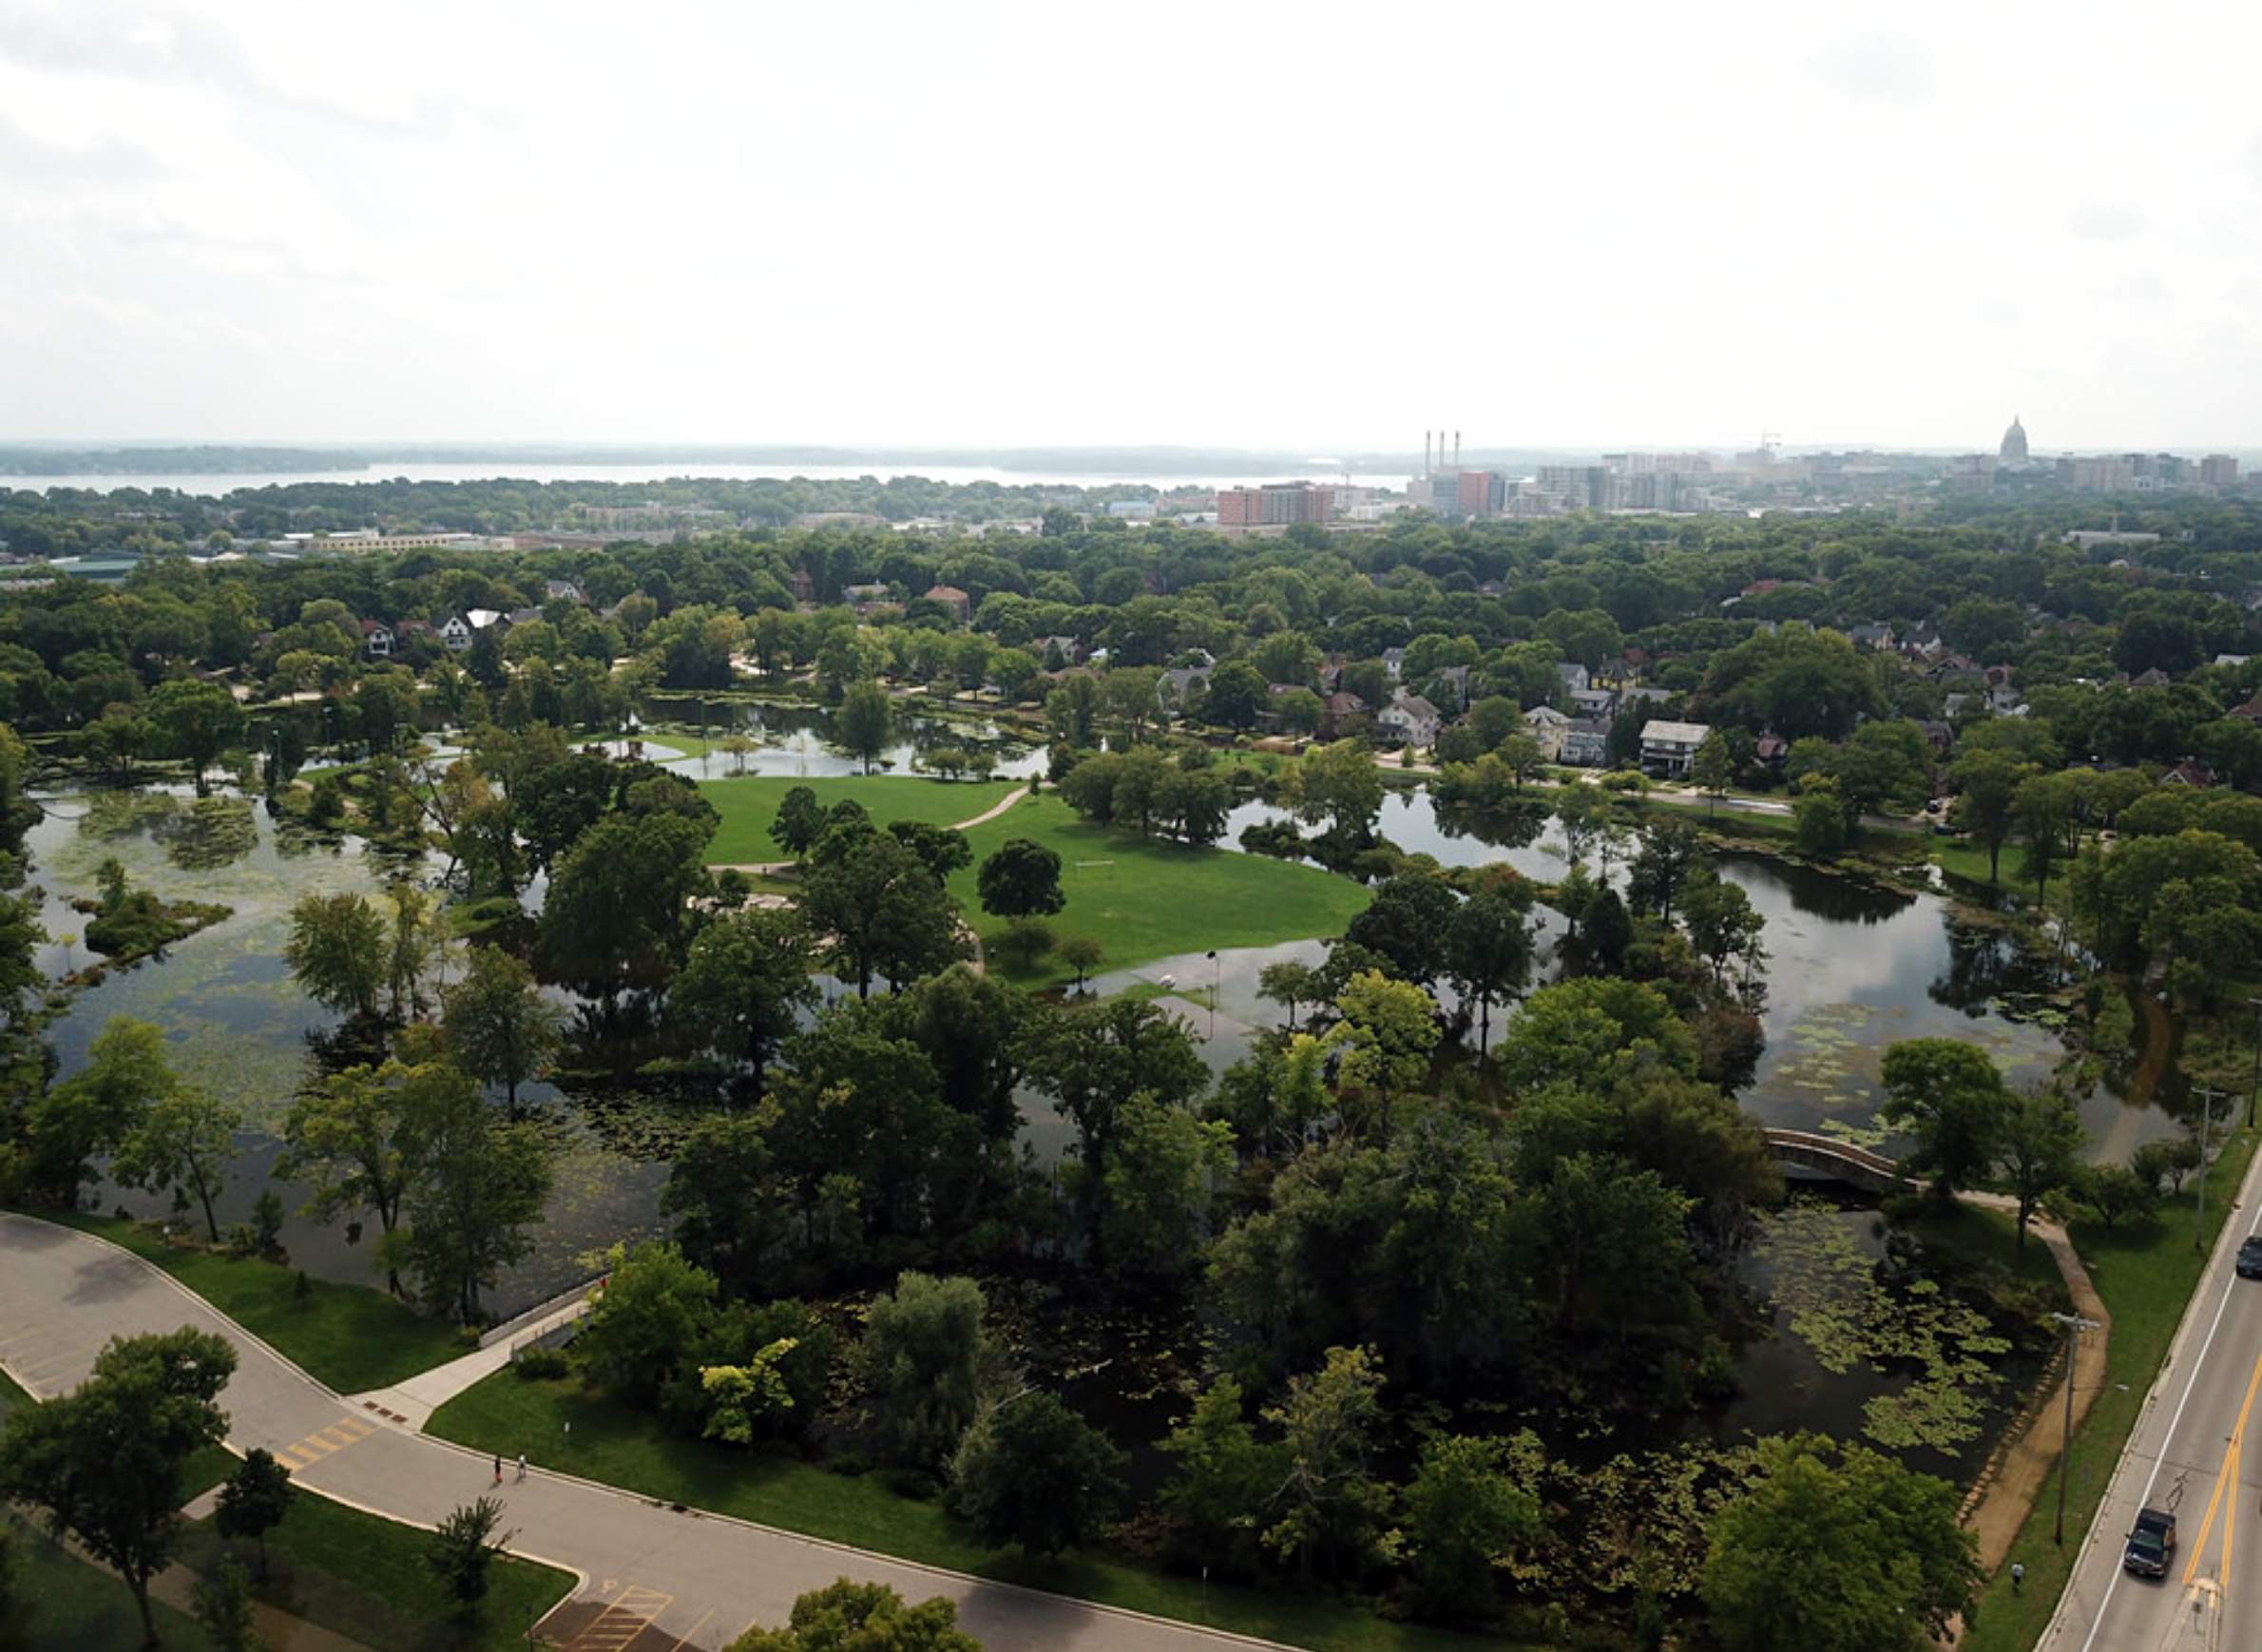
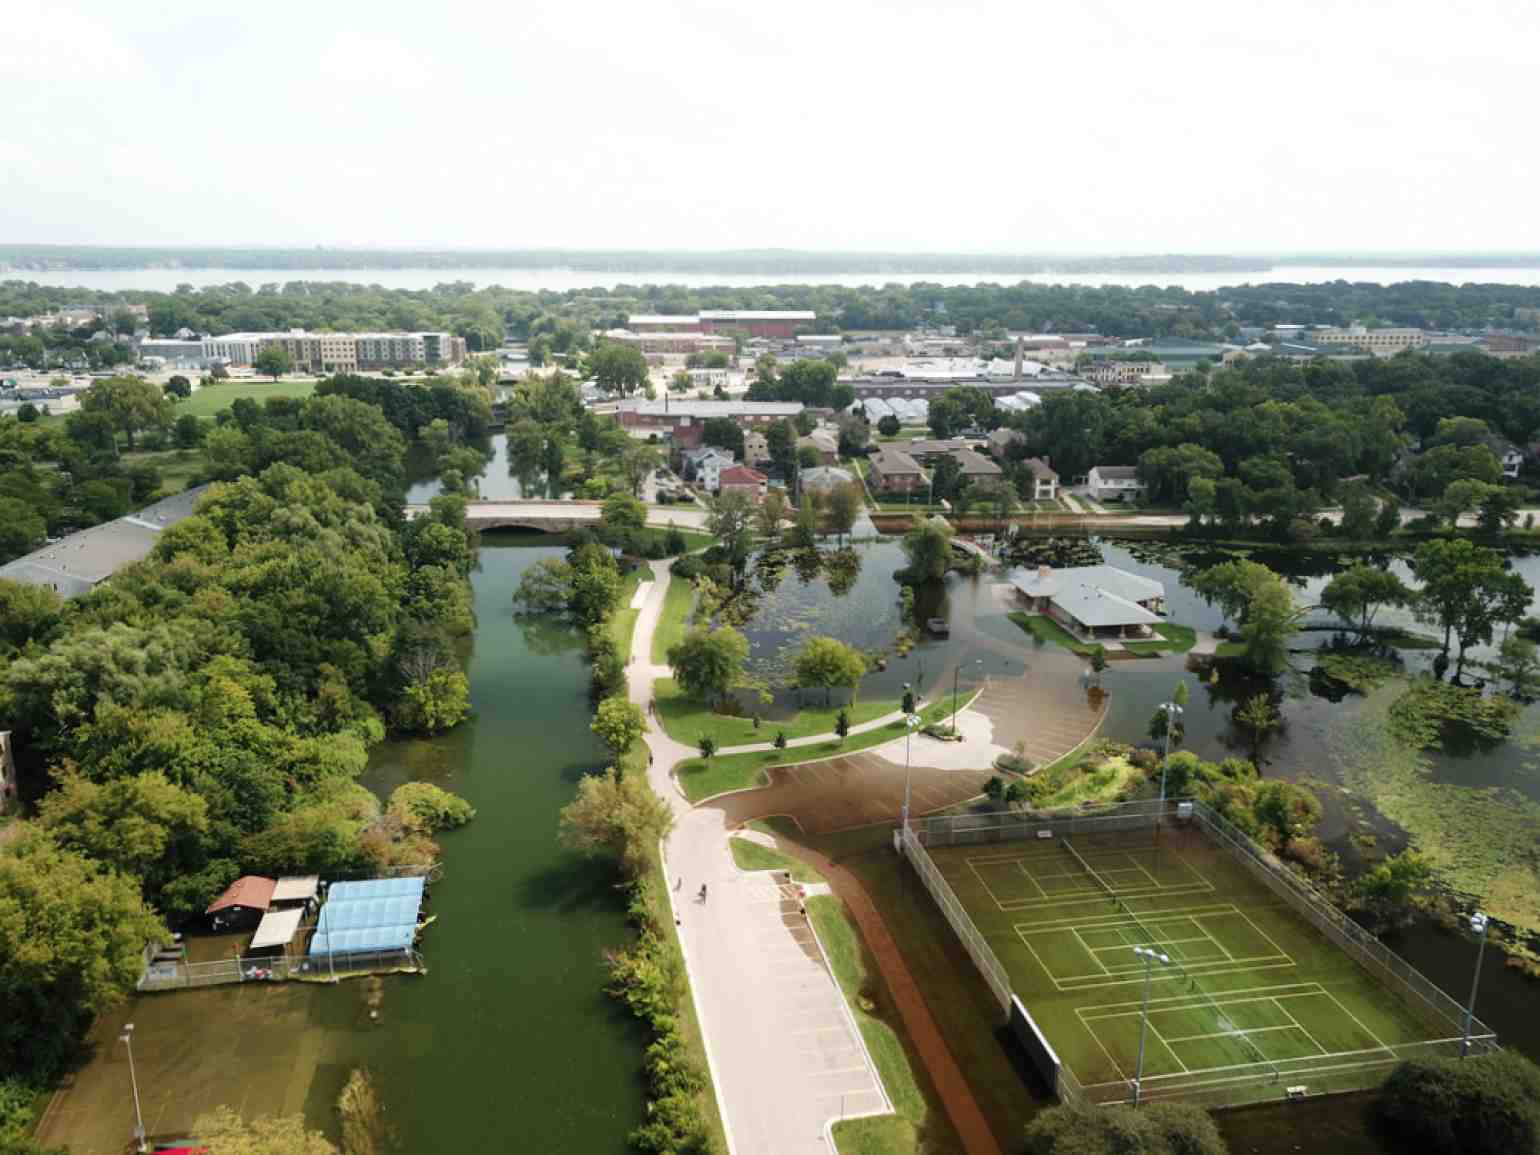
Tenney Park, located along the Yahara River between Lake Mendota and Lake Monona, was among the places flooded on the isthmus in central Madison. On Aug. 25, 2018, five days after the initial rainstorm, water levels remained high.

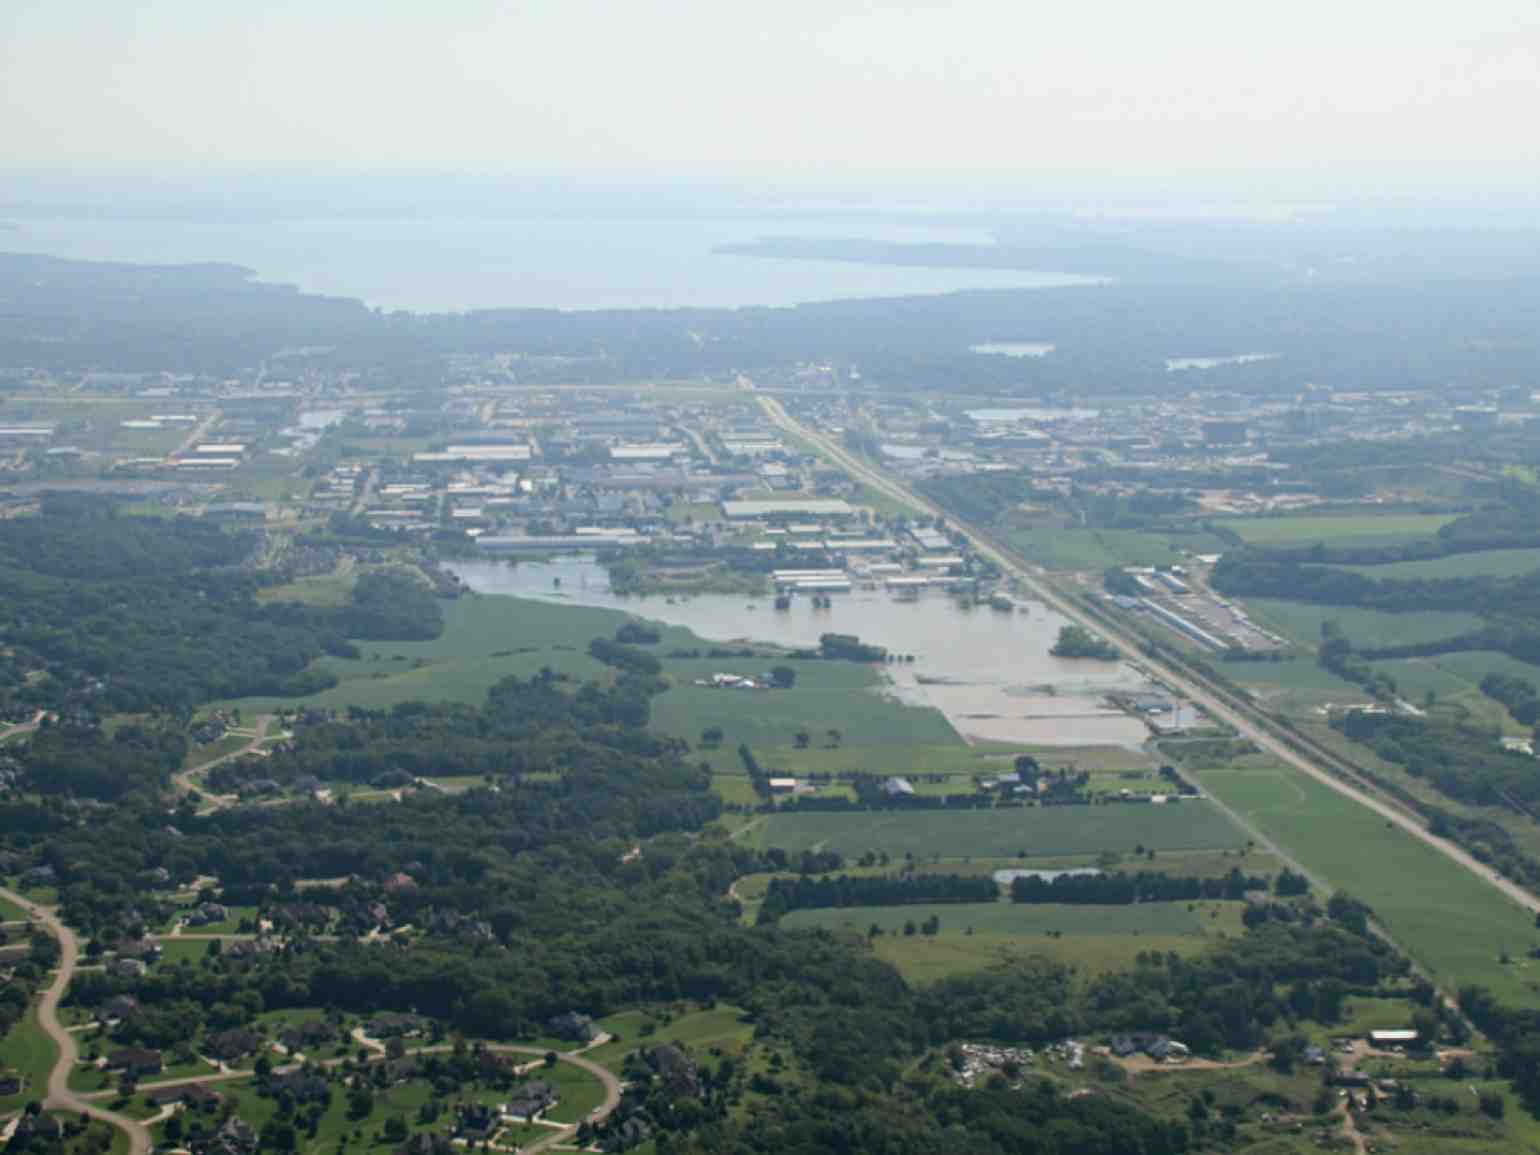
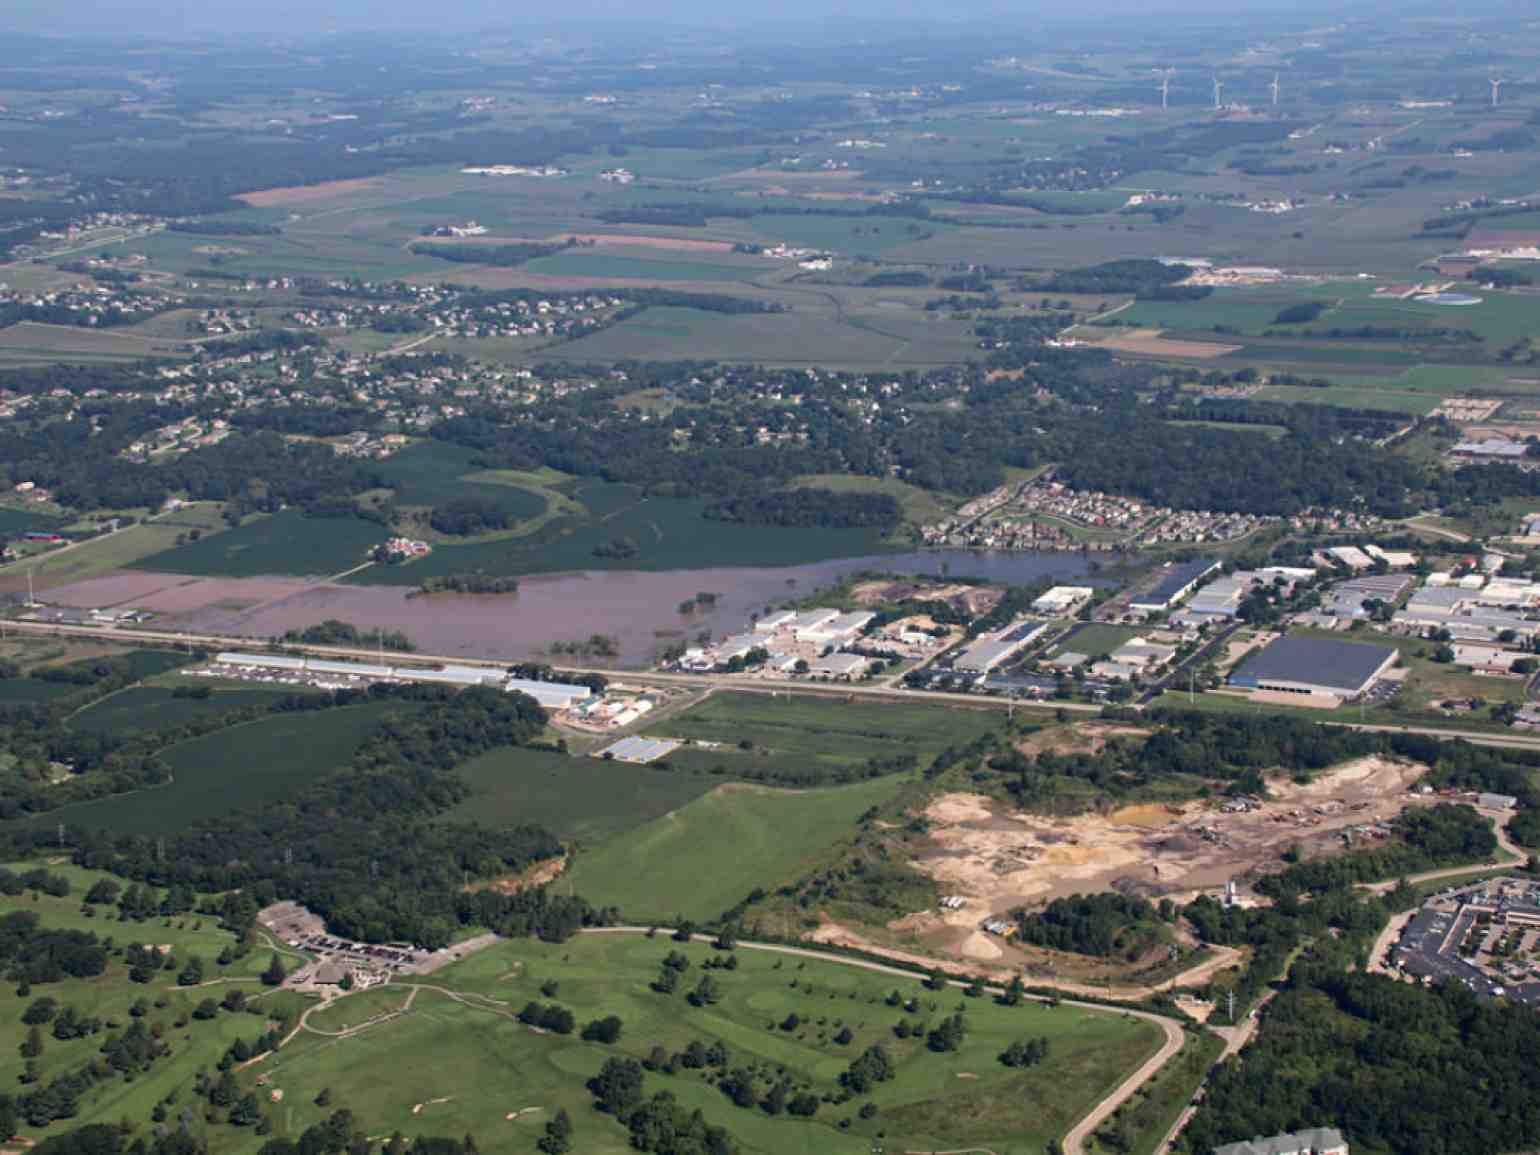
The Aug. 20, 2018 storm and resulting flooding across western Dane County demonstrated serious risks the Madison area faces from extreme rainfall. This vulnerability stems from a combination of factors, including urbanization around Wisconsin's fast-growing capital, the increasing frequency of heavy storms in the Midwest linked to global warming, and the maintenance of artificially high water levels in Lake Mendota.
While efforts after the storm focused on cleaning up and limiting flooding, Madison will need to address its vulnerability to extreme rainfall if it wants to prepare for the future. It faces three related questions. One, what exactly happened on Aug. 20? Two, how likely or unlikely are storms like that one? And three, what is the outlook going forward?
Radar of the Aug. 20 storm showed localized "bursts" of extreme rainfall exceeding 14 inches — supporting the reports of more than 15 inches in certain locations. Such levels exceed the previous 1-day rainfall record for Wisconsin — 11.7 inches, set in 1946 — by a wide margin. These localized bursts are also well beyond the 9.9 inches estimated by the National Weather Service as the "1000-year 24-hour rainfall" — referring to a hypothetical rainstorm depth that has a one-in-a-thousand chance of occurring in a given year over a specific area, a concept known as a recurrence interval.
The map on the left below shows the August 20 rainfall measured by high-resolution weather radar from National Weather Service which has been "bias-corrected" using citizen-operated rain gages. This bias correction helps to adjust the radar measurements so that they more close match the rainfall measurements provided by the rain gages. After bias-correction, weather radar provides an accurate and much more complete picture of the storm when compared with the relatively disperse rain gage observations.
The bulk of the rainfall fell outside of the Yahara watershed. The rainfall that fell inside the 281 square mile watershed works out to about 4.5 inches, equivalent to 33,272 Olympic swimming pools of water. This is a lot of water to be sure, but if the storm had occurred 15 miles to the northeast —as is shown in the "shifted" rainfall map on the right — it would have dropped 8 inches of rainfall across the watershed, almost double what actually occurred.
Given the flooding around Madison at the end of August and in early September, it is reasonable to assume that this "worst case scenario" would have been absolutely catastrophic for lakefronts and other low-lying parts of the region.
As Madison residents bounce back, it is critical to answer the question: What is the likelihood of an event such as the one on August 20 (or worse) in the future? The RainyDay software, developed by the Hydroclimate Extremes Research Group at University of Wisconsin-Madison, can help to answer this question.
RainyDay uses archived radar rainfall data to generate so-called "intensity-duration-frequency curves" that describe the relationships between rainstorm depths and the probabilities that such storms will occur. Others, including the National Weather Service, have produced such curves using rain gage observations. But rain gages paint an incomplete picture of rainfall over larger drainage areas, and thus their usefulness is limited when trying to understand flood disasters. The RainyDay software, on the other hand, can produce curves for specific drainage areas such as the upper Yahara watershed.
The intensity-duration-frequency curve for the upper Yahara watershed is shown in the table below. The key finding is that the rainfall over the watershed on August 20 had a recurrence interval somewhere between 20 and 50 years, with a "best guess" of just under 30 years. (The range of possibilities results from the variability inherent to the climate system).
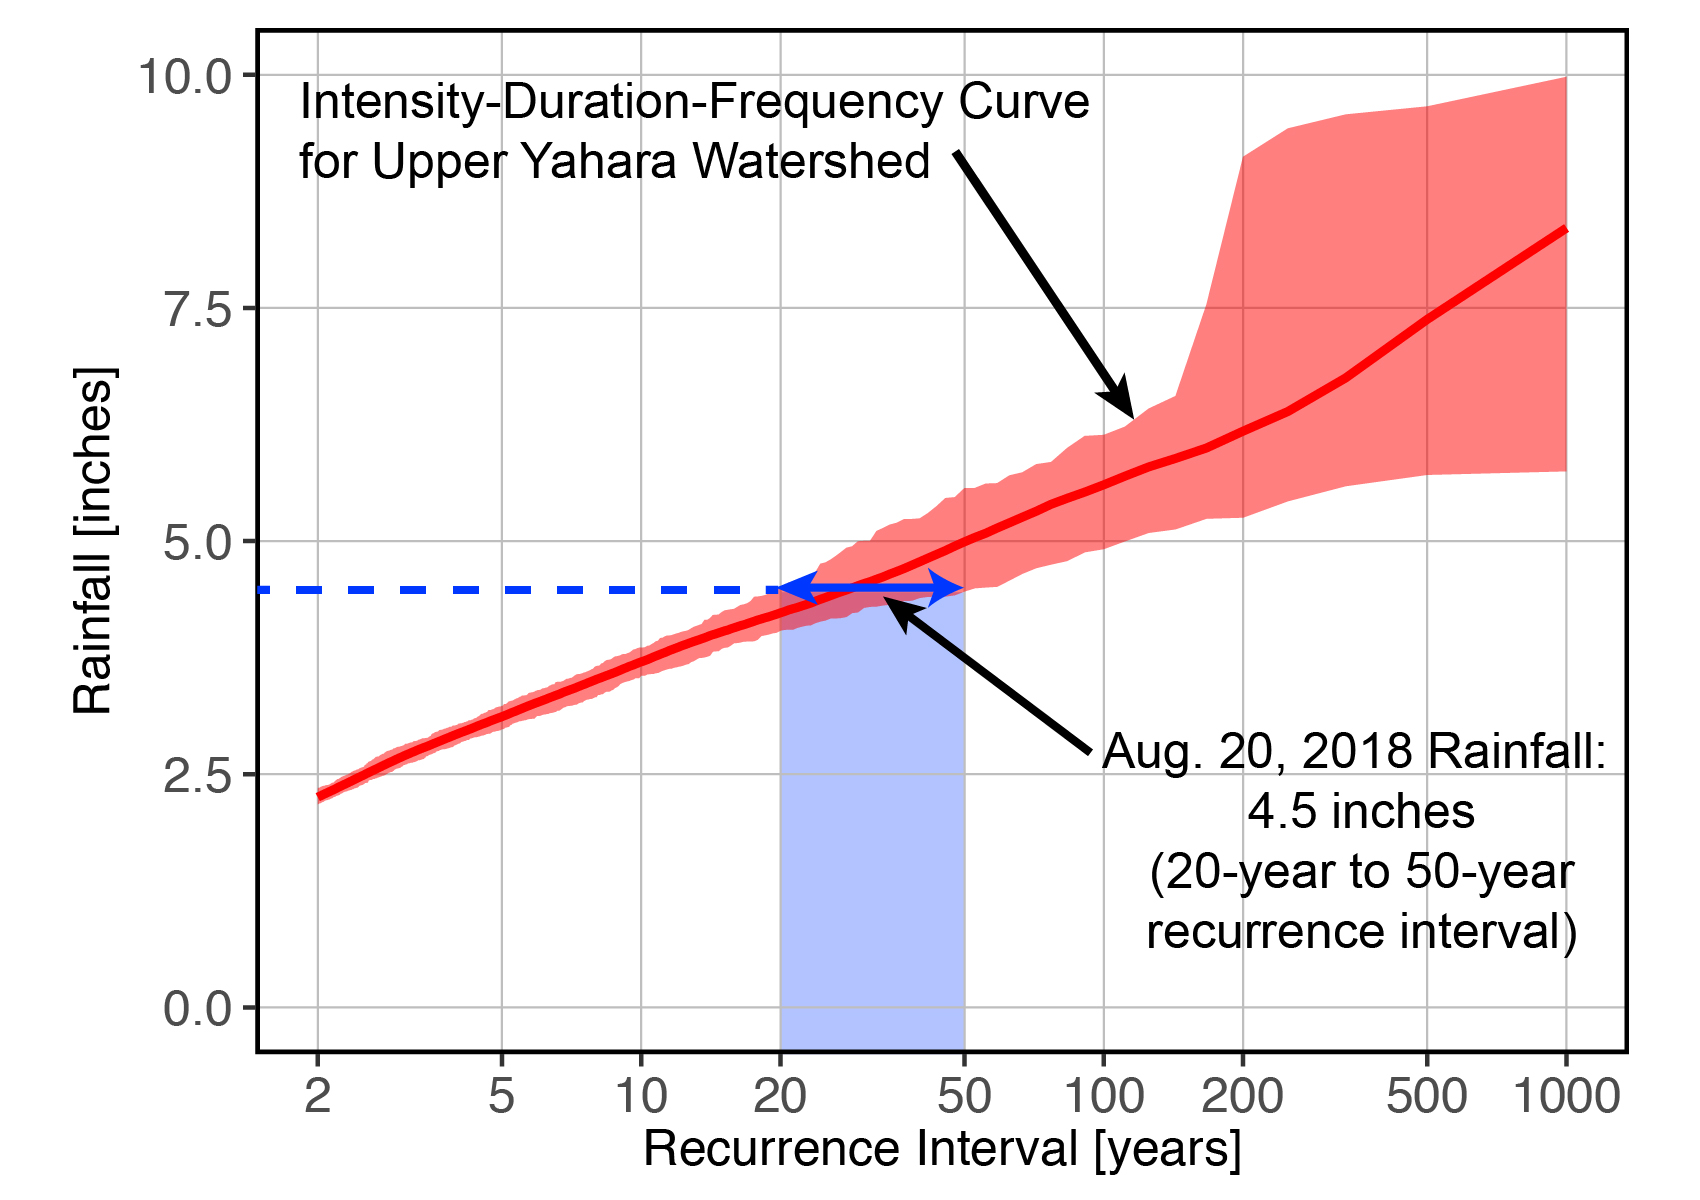
This finding stands in stark contrast with the recurrence intervals of 1000 years or more for the more localized rainfall that fell to the west of Madison.
The RainyDay modeling suggests that while the August 20 storm featured extreme record-breaking rainfall "bursts" over small areas, it was not particularly severe with respect to precipitation averages over larger areas. In other words, at scales that are relevant for flooding in and around Madison, the storm was not unprecedented, and similar or larger storms can be expected in the coming years.
This problem is likely to be exacerbated by continued climate change impacts on extreme rainfall. The fact that the Madison area hasn't seen flooding like this in the past is probably partly the result of luck, though further examination of historical rainfall records would offer a more complete explanation.
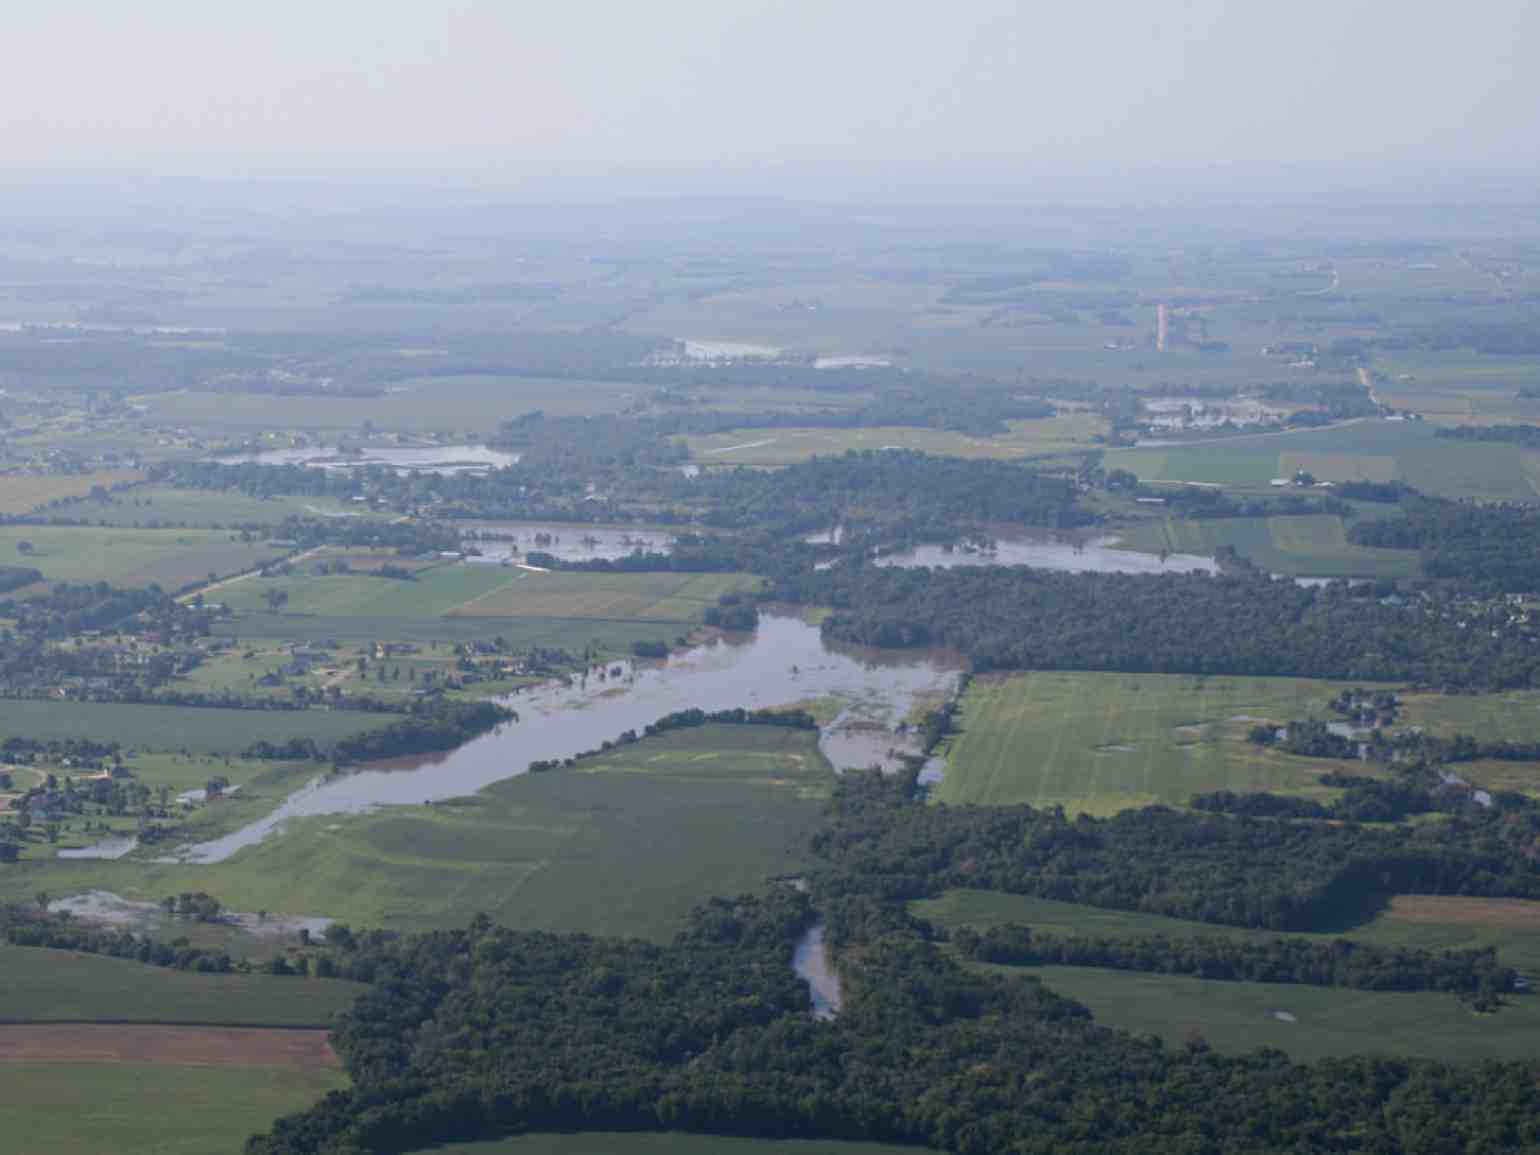
It takes more than heavy rainfall to produce a major flood, though. For example, it is likely that the impacts would have been less severe if the rain had been concentrated in the northern portion of the Yahara watershed in Columbia County. The largely agricultural landscape there can soak up more rainfall than the urban and suburban areas in and around Madison. Urbanization around Dane County, along with artificially high water levels in Lake Mendota, explains why the August 20 storm, which had a rainfall recurrence interval of 20-50 years, produced historically high lake levels and flooding.
Assessing localized flood vulnerabilities and associated mitigation options, including stormwater infrastructure investments and better management of lake levels, is challenging but necessary to improve Madison's resilience to future rainfall and flood disasters.
Daniel B. Wright is an assistant professor in the Department of Civil & Environmental Engineering at the University of Wisconsin-Madison. He studies extreme rainfall and flooding, and worked previously as a disaster risk management consultant at the World Bank and as a research fellow at NASA.
This report is the copyright © of its original publisher. It is reproduced with permission by WisContext, a service of PBS Wisconsin and Wisconsin Public Radio.