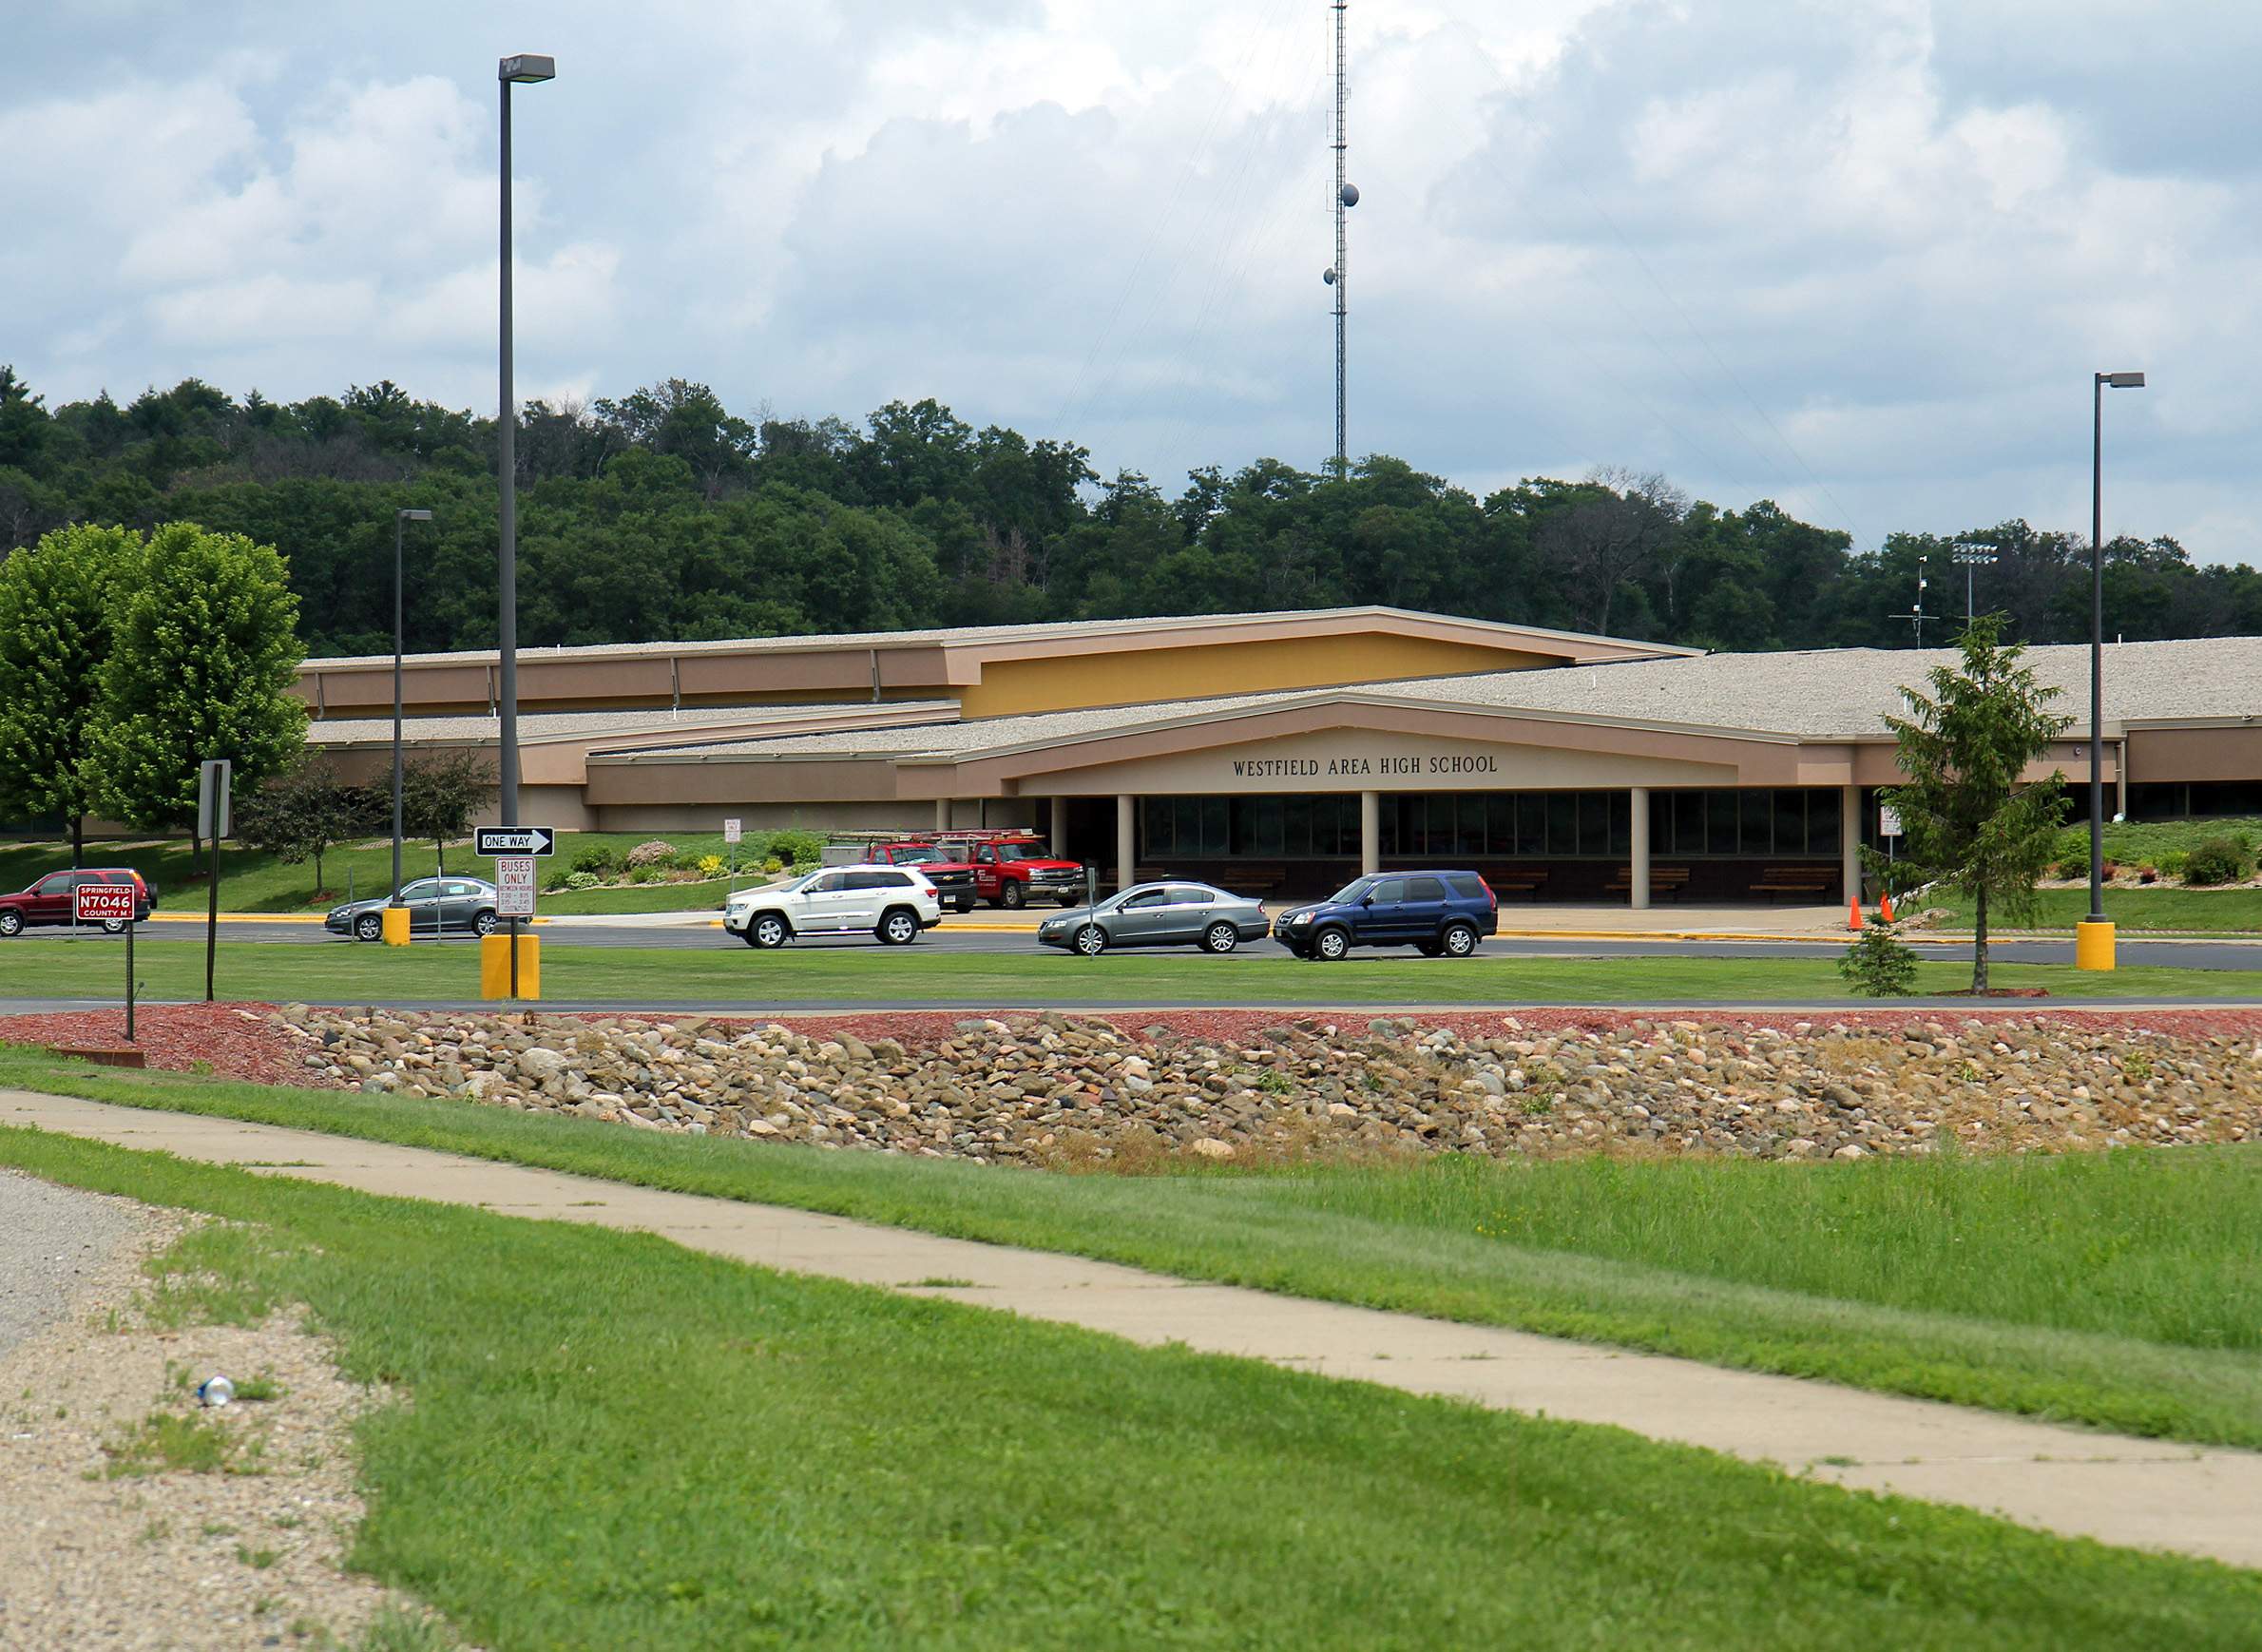
Royalbroil (CC BY-SA 3.0)
The School District of Westfield, located in central Wisconsin, is among rural districts in the state that are facing declining enrollment and costs that exceed revenues.

Public education has been a cornerstone of American life since the formation of the first schools in the early 1600s. Since that time, the mechanisms through which schools are funded have become considerably more complex. In Wisconsin, a desire for quality education and the costs of making such an investment has led to a funding system that can vary significantly by where a school is located.
In Wisconsin's contemporary policy environment, school revenue is directly linked to two primary sources — state funding and property taxes. State funds are largely based on school district enrollment, while property taxes go directly to local districts. Because enrollment is declining more dramatically in rural districts, this funding structure puts a higher burden of support on residents of those areas and places their schools at risk of underfunding.
Determining exactly which school districts are rural and which are not can be challenging because rurality is a multidimensional concept that is defined by economic activity, population density, commuting patterns, distances to cities, access to services and other demographic measures.
A classification system developed by the National Center of Education Statistics assigns school districts to four categories based on the population of the area and their distance from an urbanized area. Rural districts are defined as being at least 5 miles from even a small urbanized area. Districts in the town category are located in places with a densely settled area with a population of less than 50,000, while suburban districts are outside a principal city but inside an urbanized area. Finally, urban districts are located inside a principal city at the heart of a metropolitan area.
This map shows all school district's location categories for the state.
Some examples of distinct categories may not fit what one thinks of a specific location. Kenosha is a suburban district despite being fourth largest city in the state. It is categorized as a suburban district because of its proximity to the Chicago metro area. Meanwhile, New Berlin is categorized as rural district instead of as town or suburban because of its location with respect to Milwaukee, causing it to be considered outside an urban cluster.
By these definitions, 4 percent of the school districts in Wisconsin are urban, while 19 percent are suburban. Most school districts in the state are classified as either town at 22 percent or rural at 55 percent.
However, when it comes to the overall number of children, almost 60 percent of all Wisconsin public school students attend urban and suburban districts due to higher population density. Overall, 31 percent of total students are in urban districts, and 28 percent are in suburban districts. The remaining student population are almost equally distributed between town districts at 22 percent and rural districts at 19 percent.
The map shows Wisconsin's school age population by district based on data from the U.S. Census Bureau's American Community Survey.
In Wisconsin's urban districts, the average student enrollment is 15,800, though that number drops to 11,900 if Milwaukee Public Schools is not included. The district is by far the state's largest, with over 78,000 students in the 2016-17 school year. Suburban districts' average enrollment is about 3,000, while town districts average 2,000 students. In the state's 233 rural districts, the average enrollment is only 700 students.
The majority of any school district's budget goes towards instructional staff salary. Schools also incur costs related to student support, operation and administration, transportation, facilities, food and community services. Regardless of the enrollment size of a district, though, certain fixed costs are required to operate schools.
Fixed costs such as transportation, providing food services and maintaining school facilities are more or less the same regardless of the enrollment size of a district. These responsibilities leave smaller-enrollment rural districts with higher costs per pupil, relative to larger urban and suburban districts with greater economies of scale. On average, costs per pupil in rural districts are $1,220 higher than costs per pupil in urban and suburban districts.
In the 2016-17 school year, the average cost per pupil in Wisconsin was $13,182, with these costs higher in rural parts of the state. The average revenue per pupil statewide was $13,459, slightly higher than the per pupil cost.
In this map, darker shading indicates higher revenue levels and costs per pupil at the school district level. The revenue per pupil map includes funds used for operating budgets only and does not include funds for debt services or acquisition, renovations and construction of school facilities.
Total revenues vary in amount, with larger districts requiring a much larger overall budget than smaller districts. However, all districts rely on revenue from local property taxes alongside state and federal funds. State funding may include general aid as well as funds earmarked for specific categories of districts, such as ones that are sparsely populated, high in poverty or have special transportation costs. These funding streams are called categorical aid.
Rural districts' average revenue per pupil tend to be higher due to their lower enrollment. One way the Wisconsin Legislature has attempted to address this funding disparity among rural school districts has been with changes to categorical aid. In early 2018, the enactment of Act 141 provided for low revenue adjustments and increased sparsity aid to many districts. The majority of rural districts in Wisconsin were eligible for this increase in aid.
Just over three-quarters of the districts in Wisconsin had revenue higher than costs, on a per -pupil basis, in the 2016-17 school year. The remaining 24 percent of school districts had costs higher than revenue. These latter districts may have had capital improvement expenses that were not considered in their revenue totals or may have been using their fund balances in order to end the year in the black. In short, they operated in deficit spending in 2016-17.
The chart shows the difference between revenue and costs per pupil in 2016-17. Districts that fall above the line have revenue per pupil higher than their costs per pupil.
When comparing district revenue to costs by location category, those in rural areas more often rely on their fund balance — or must look for ways to cut spending. By category, 12 percent of urban, 22 percent of suburban, 21 percent of town and 27 percent of rural districts had operational costs that were greater than their revenues. One year of deficit spending is not necessarily a need for concern, but if a district experiences deficits over a period of time, it will eventually be confronted with difficult budgetary decisions.
Understanding the relationship of revenue and costs are essential to discussions about equitable school funding. If an increasing number of districts in rural Wisconsin are in deficit spending or relying on fund balance accounts to stay in the black, it may be a sign that a more significant overhaul of school funding in the state is needed.
The formula used to determine how much funding a public school district in Wisconsin receives from the state has far-reaching implications for the resources available and quality of education received by students. But this formula has different implications for schools across urban, suburban, small town and rural settings.
Wisconsin's system for funding education has long been a subject of public debate about its structure and priorities. Much of the discussion about the school funding formula has been centered on the equity of revenue limits. One focus in advance of the 2017-19 state budget was the Department of Public Instruction's Fair Funding for our Future proposal. In the spring of 2018, the state Legislature's Blue Ribbon Commission for School Funding conducted a series of public hearings to address possible policy reforms.
Changes to the funding formula could have dramatic implications for public schools across Wisconsin. The current formula was created in the 1970s and has seen a series of modifications since that time. In the fall of 1993, the state Legislature instituted a limit on the revenue a school district is allowed to receive each year. A district's revenue limit is the maximum amount of dollars that it can raise.
As the 2010s wind down, observers are questioning whether these limits hinder districts from providing adequate resources to educate students.
Declining enrollment can affect any school districts, but rural districts have felt the greatest impact in the 2010s. Fifty-nine percent of Wisconsin’s school districts experienced declining enrollment from 2012-13 to 2016-17.
Breaking these numbers down by location, rural districts declined the most, with 67 percent of the districts experiencing a drop in student population. The number of town districts with fewer students during this period was 56 percent, followed by suburban districts at 45 percent. The number of students in urban districts declined the least with 41 percent of districts experiencing decline.
This chart shows the enrollment change from the 2012-13 to 2016-17 school years of the 422 school districts in Wisconsin, as well as each district's 2016-17 enrollment. Declining enrollment at Milwaukee Public Schools is due in part to a drop in the number of school-aged children in the city, as well as a result of a growing number of students attending private schools.
Over the five-year period between the 2012-13 and 2016-17 school years, enrollment at urban districts grew an average of one percent. Student numbers at suburban, town and rural districts, on average, declined over this time. Students at suburban districts declined the least at 0.3 percent, while enrollment in town districts declined by 1 percent, roughly as much as urban districts grew. However, rural district student numbers declined the most, with an average decline of 3.3 percent.
School district revenue limits cap the amount districts can receive each year. Each district's unique revenue limit is based on a formula that accounts for recent enrollment, the previous year's revenue from state and local sources, capital improvements and debt. In 2016-17, the average revenue limit per pupil in Wisconsin was $10,439, with variation across the state. These limits apply to revenues received from two sources: state funding and local levies, mainly through local property taxes.
The map shows the revenue limit per pupil by school district. The per pupil revenue limit is computed by dividing the district's revenue from the previous year by its average enrollment over the past three years.
Rural districts have the highest revenue limit per pupil of the four location classifications. Rural districts' revenue limit per pupil average is $11,170, while the revenue limit per pupil in the other three averages $10,470.
Rural schools are in the most vulnerable position under the current funding formula. In Wisconsin, a majority of districts are considered rural, but they also have the smallest number of students. These same districts also experienced the greatest decline in enrollment over the five-year period between the 2012-13 and 2016-17 school years.
With declining enrollment and dwindling financial resources, rural districts are confronted with challenging decisions. Districts must choose whether to go to referendum to meet operating expenses, determine what can be cut from the school budget, or must decide how long they can delay facility renovations. However, these actions are merely stopgap measures that do not truly resolve the broader financial challenges confronting school districts with declining enrollment.
Sarah Kemp is a researcher with the school enrollment projections program at the University of Wisconsin Applied Population Laboratory and the UW-Madison Department of Community and Environmental Sociology, and studies school demography with a focus on rural schools. She is also a member of the Lakeland Union High School Board of Education.