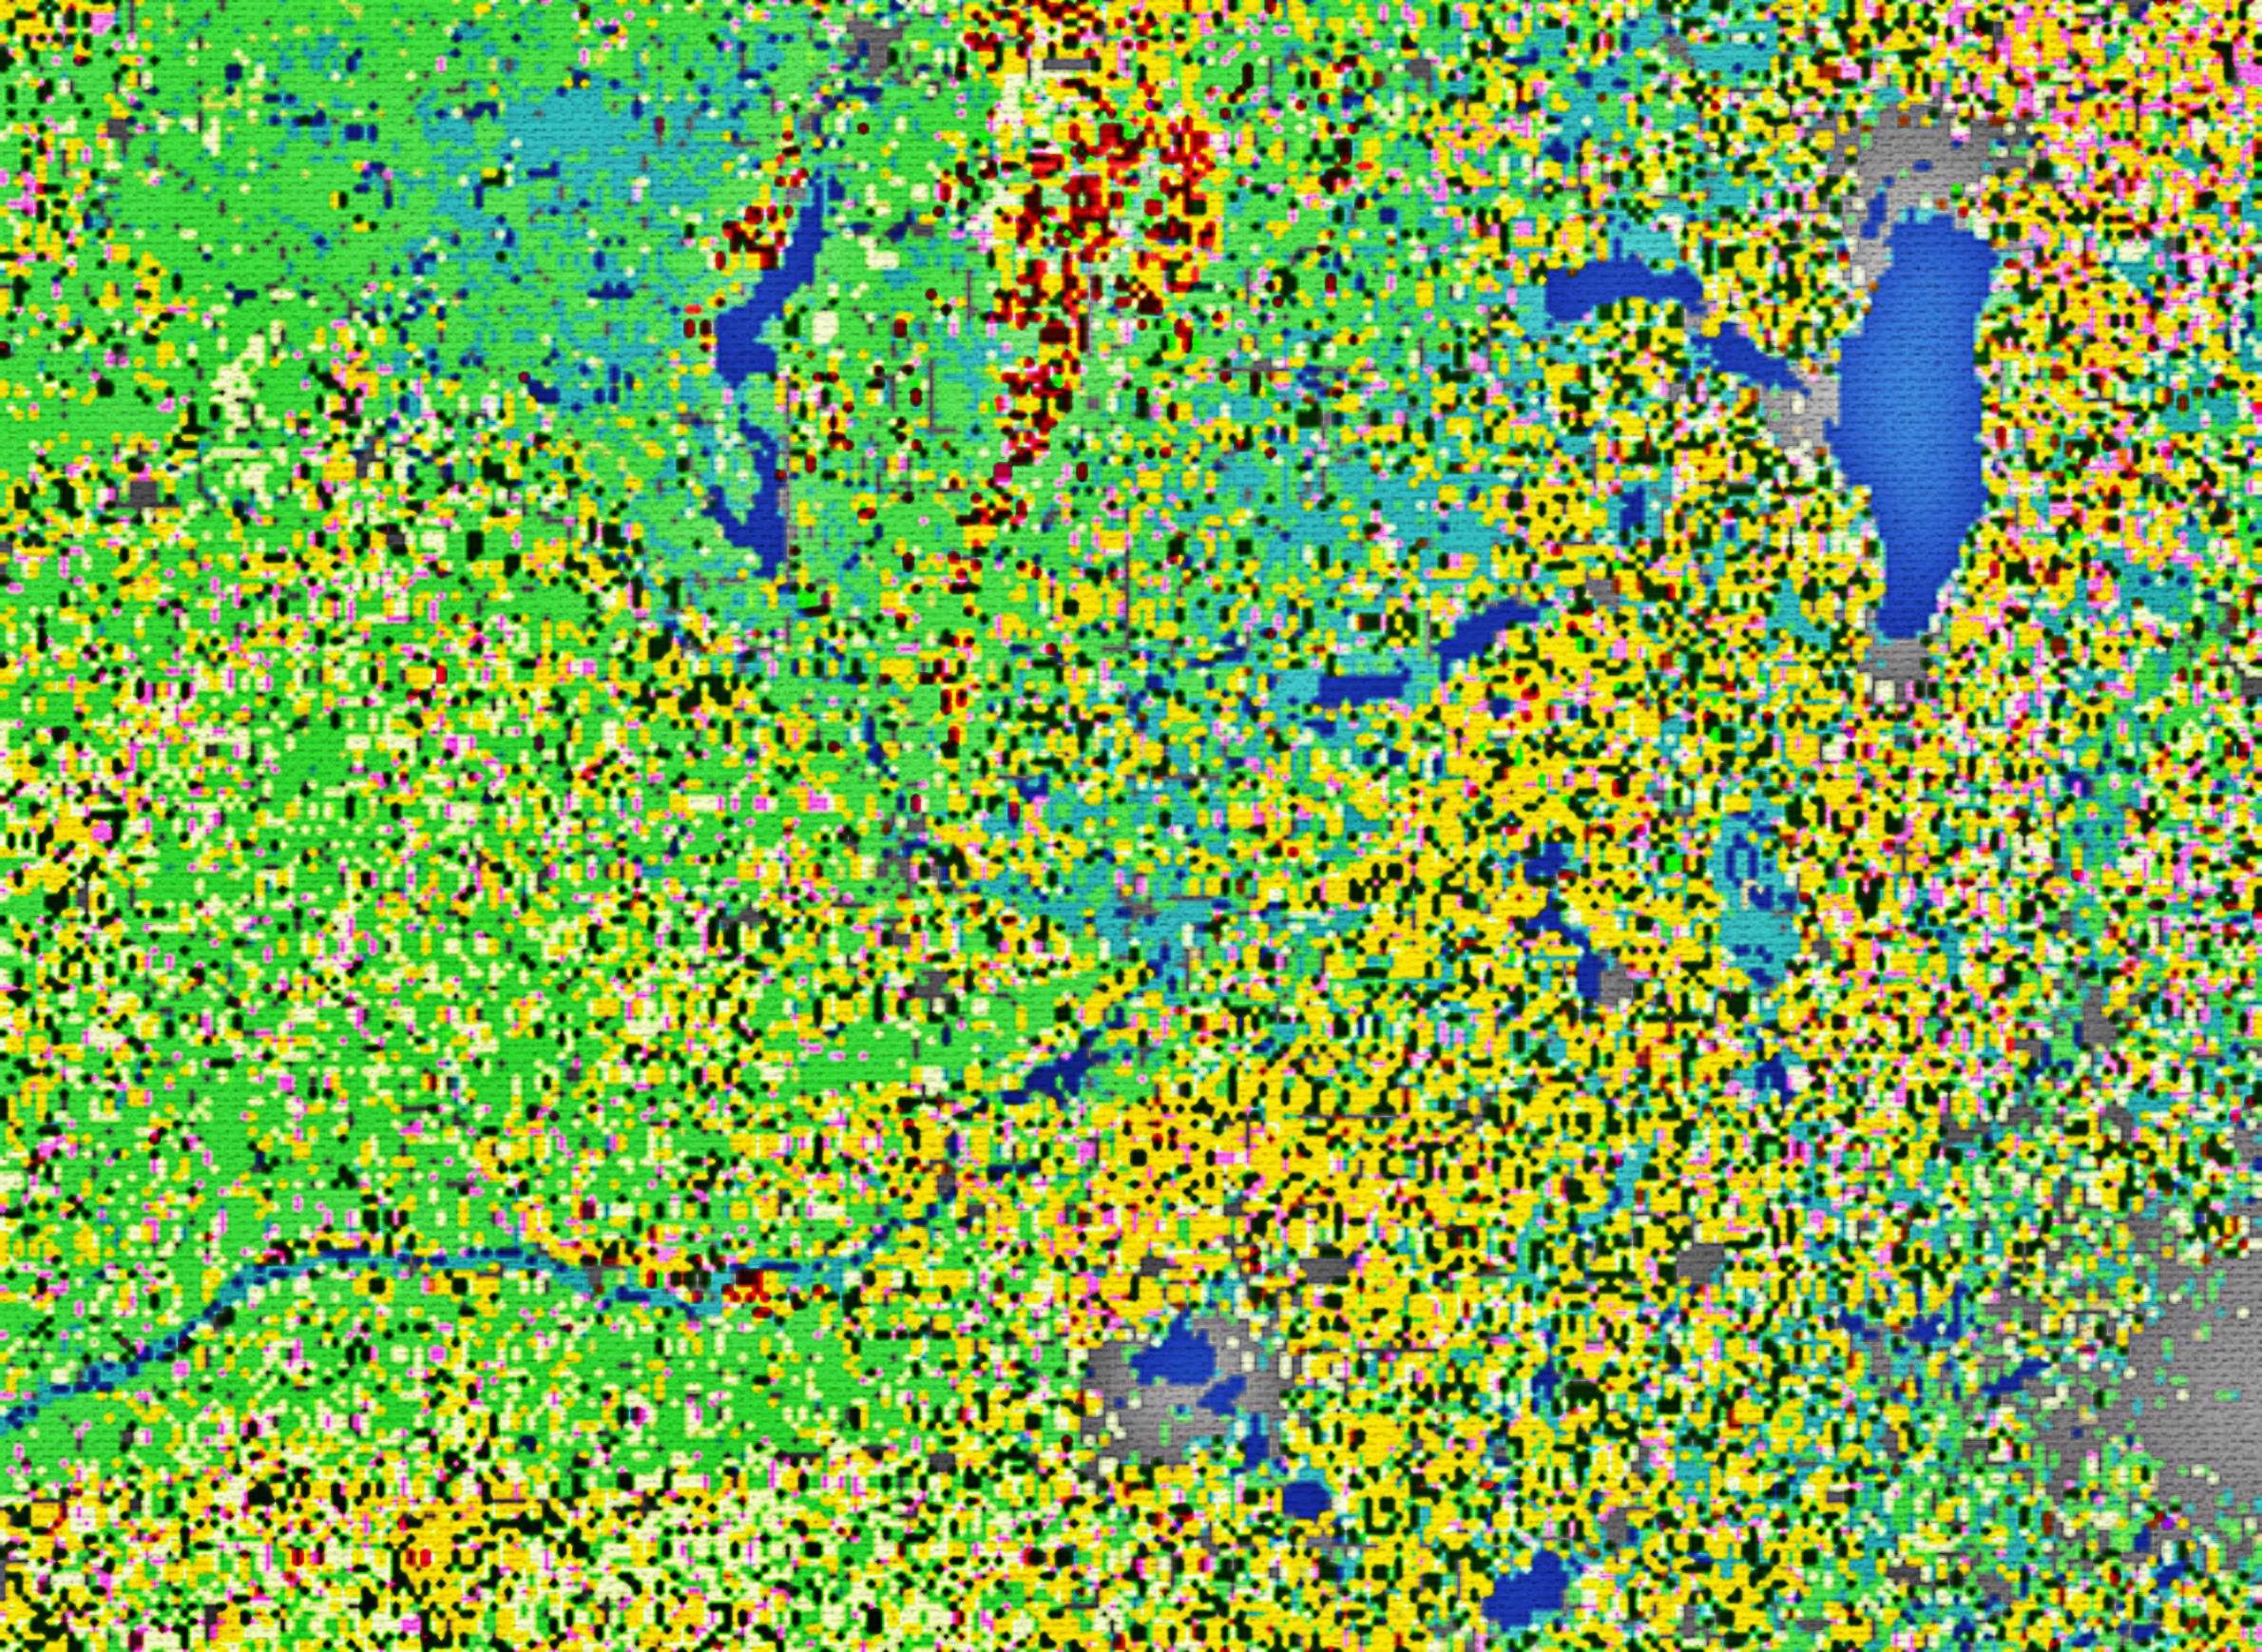
Illustraton based on image via Özdoğan Lab Group

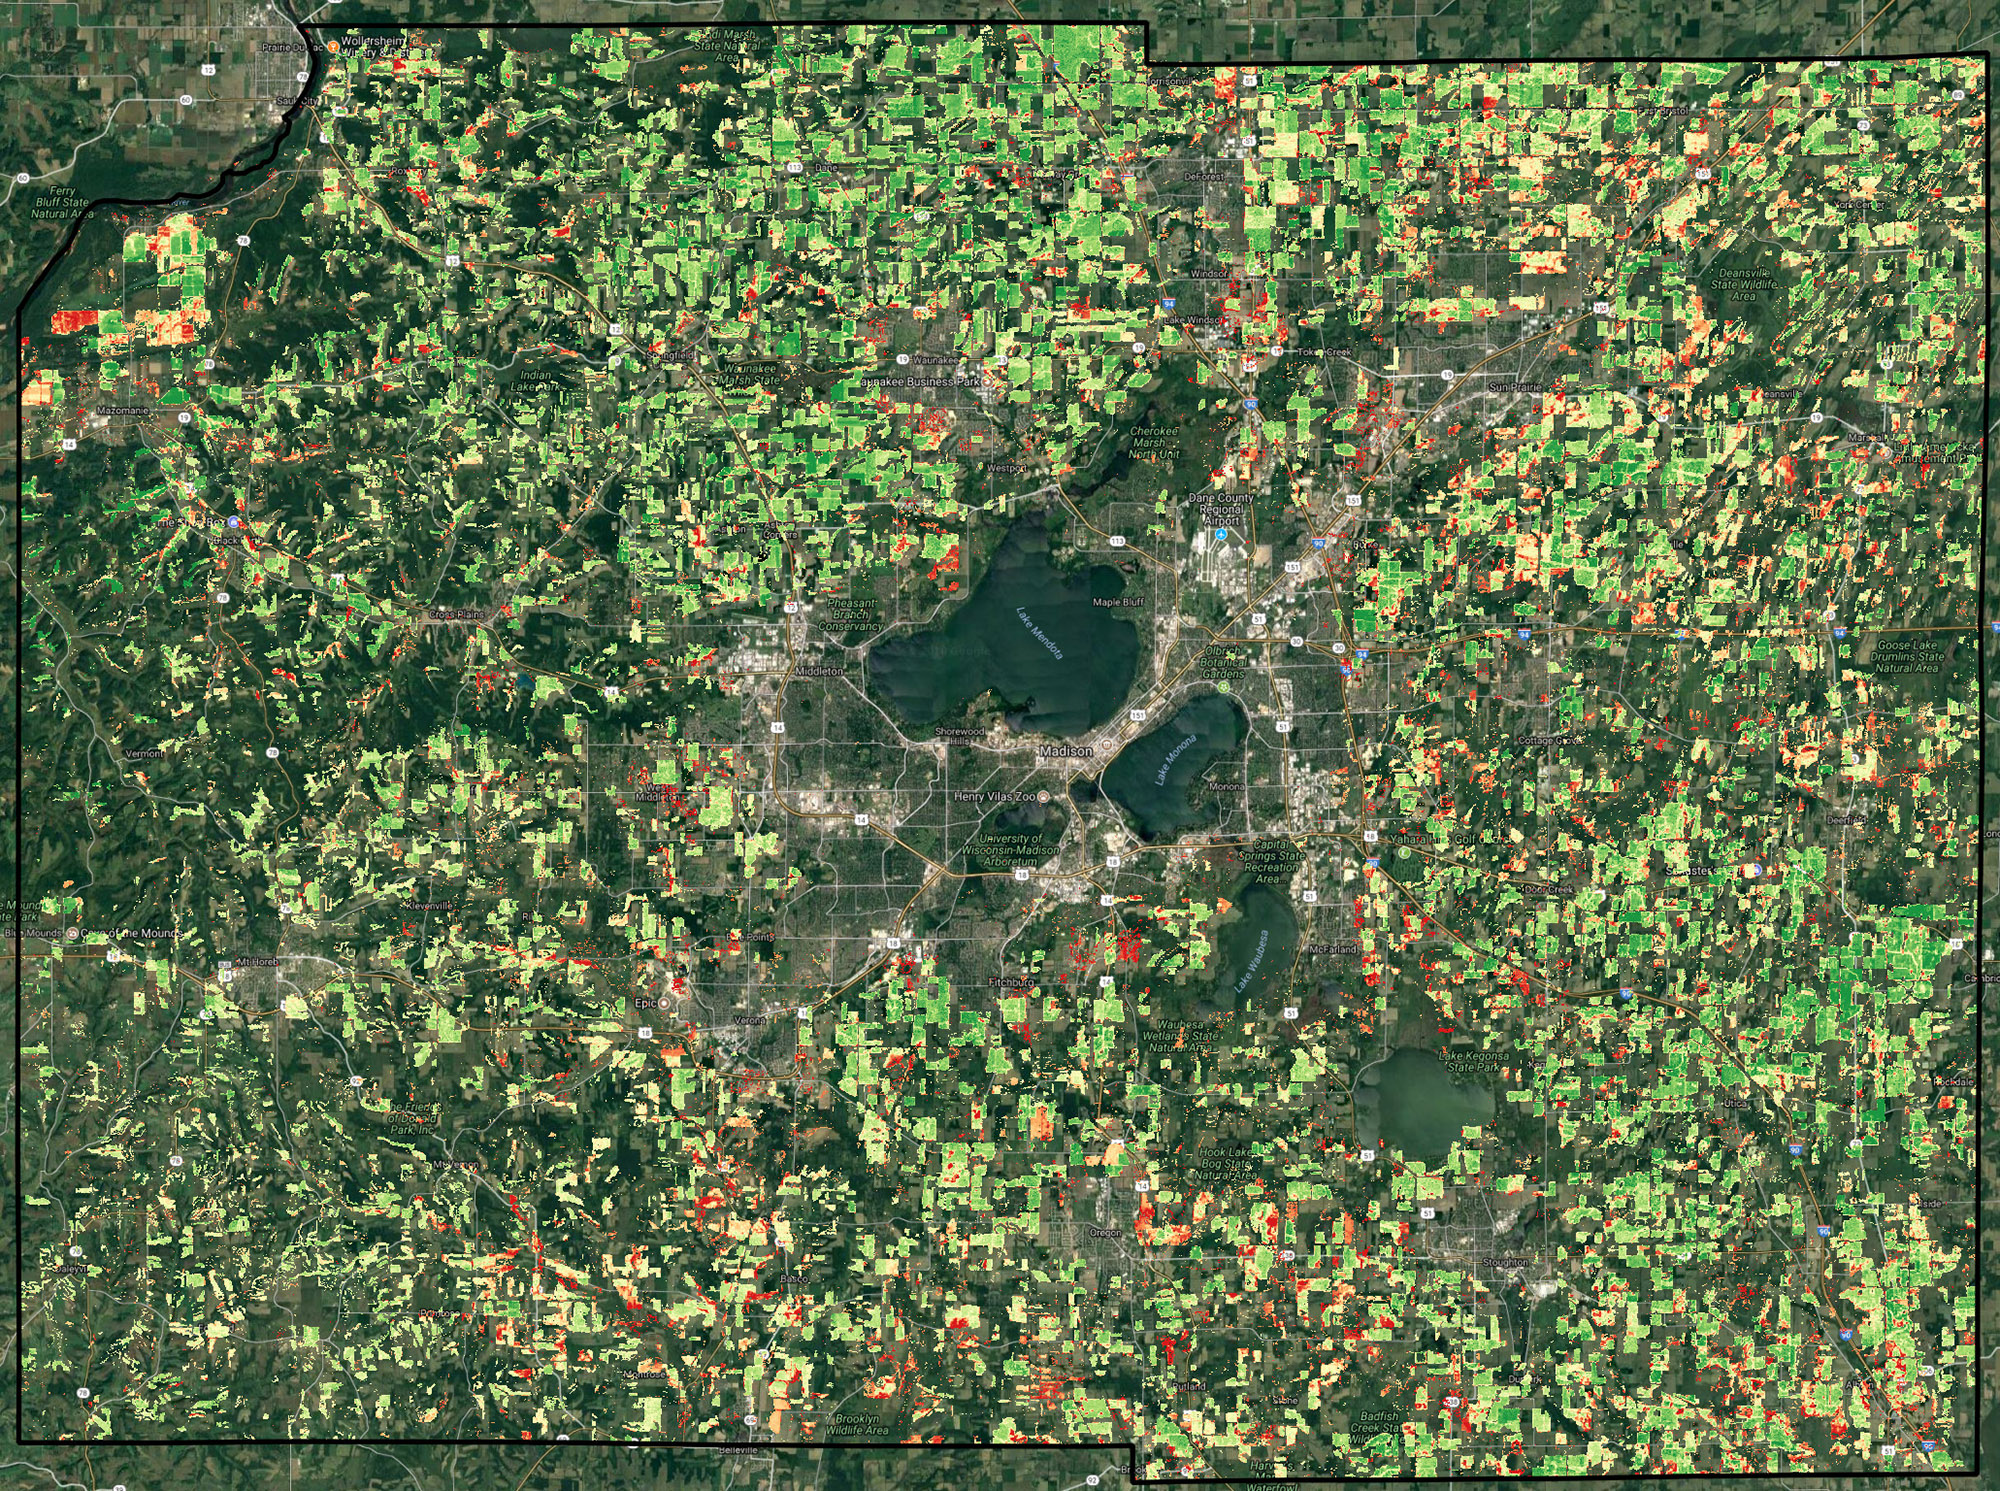
Using space-based cameras onboard satellites that orbit Earth at a distance of more than 400 miles above sea level, scientists are able to estimate the yield of individual corn and soybean fields across Wisconsin.
That capability is only one among an expanding suite of remote sensing functions made possible by satellite imagery, as well as advances in computing technologies, that researchers from the University of Wisconsin-Madison and elsewhere are using to better understand the planet's croplands.
Tracking global croplands and how they are changing is a massive, pressing and complex undertaking: 40% of Earth's land surface is used for agriculture, and much of it is remote and poorly documented. Meanwhile, as the world population grows toward an estimated 10 billion people by 2050, most of the remaining share of arable land not already under cultivation is in ecologically sensitive regions like the Amazon River Basin in South America.
The main challenge for the agricultural sector moving forward will be to produce significantly more food without depleting natural resources, and one of the best ways to understand how farmers respond to these global pressures and constraints is from a distance, specifically low-earth orbit. That perspective is the focus Mutlu Özdoğan — an associate professor of forest ecology and environmental studies at UW-Madison’s Nelson Institute for Environmental Studies — who leads a research group that maps global croplands.
"Agriculture has this sort of interesting balancing act," Özdoğan said at a February 21, 2018 talk for the Wednesday Nite @ The Lab lecture series on the UW-Madison campus, recorded for Wisconsin Public Television's University Place. "Not only do we have to … increase food [production], and also help people bring a livelihood out of agriculture, but also we need to do that without wreaking havoc [on] this planet."
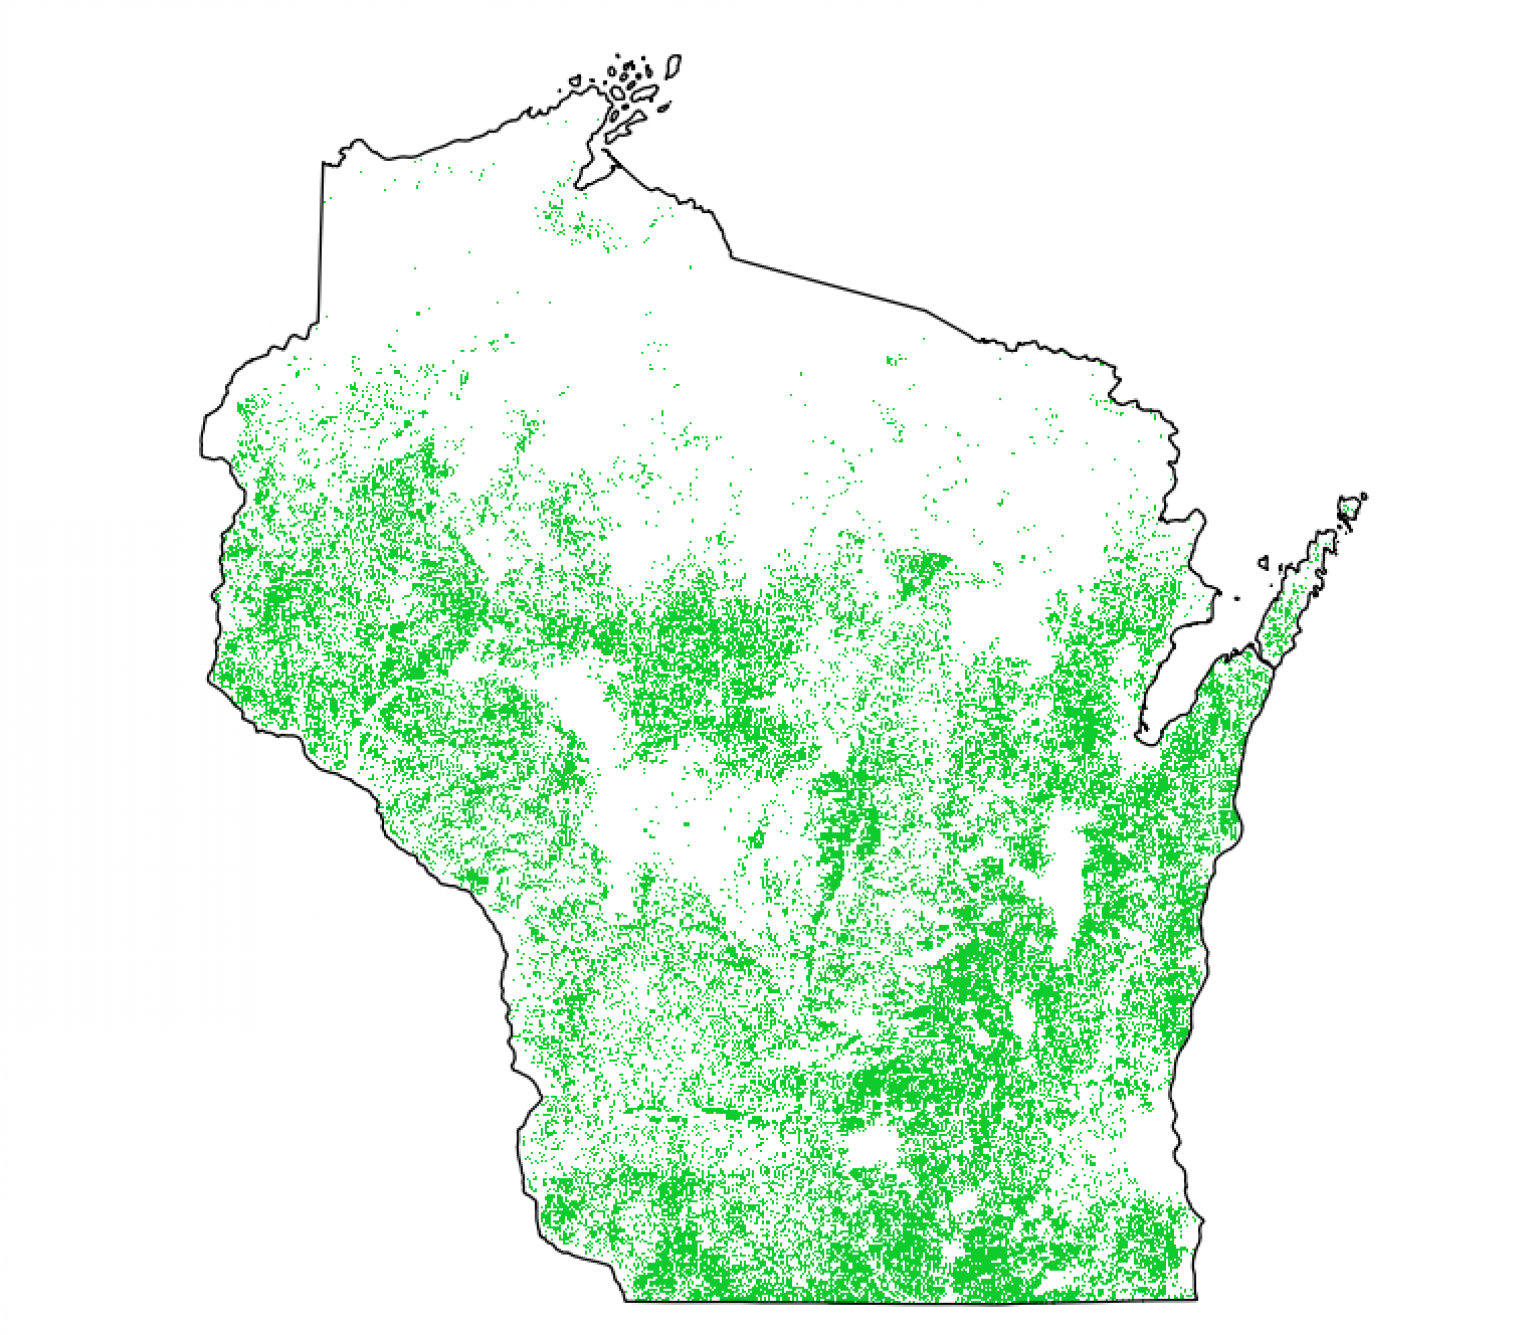
Documenting how farmers adjust to a world in flux is one goal of Özdoğan's research, which utilizes imagery from NASA's Landsat satellites and the muscle of cloud computing to develop detailed maps of the globe's croplands at exceptionally high resolution — 30 meters — a goal achieved in collaboration with several other institutions. In Wisconsin, these maps precisely display where topography and soil-type have limited the spread of cropland in regions like the Driftless Area and Black River State Forest.
Assuring cropland maps are as accurate and robust as possible involves a multi-step process, beginning with human analysis of thousands of images, Özdoğan said. He and his colleagues sifted through the imagery to identify where land is used for agricultural purposes, a process that's easier in some regions than others. For instance, irrigated fields in the deserts of Arizona or Saudi Arabia starkly stand out against the arid landscape, while agricultural fields can be difficult to tease apart from non-agricultural land in some parts of Africa and Asia.
In Wisconsin, agricultural land is relatively easy to pinpoint, Özdoğan said, as fields follow familiar patterns and stand out against natural and urban landscapes.
Once the team has identified a certain number of images, researchers use machine learning to speed up the task of screening images of the planet's entire landmass. They do this by their human-interpreted results into a computer algorithm, which then applies those results to uninterpreted images. On-the-ground confirmation helps validate and fine-tune the computer-generated maps, Özdoğan said.
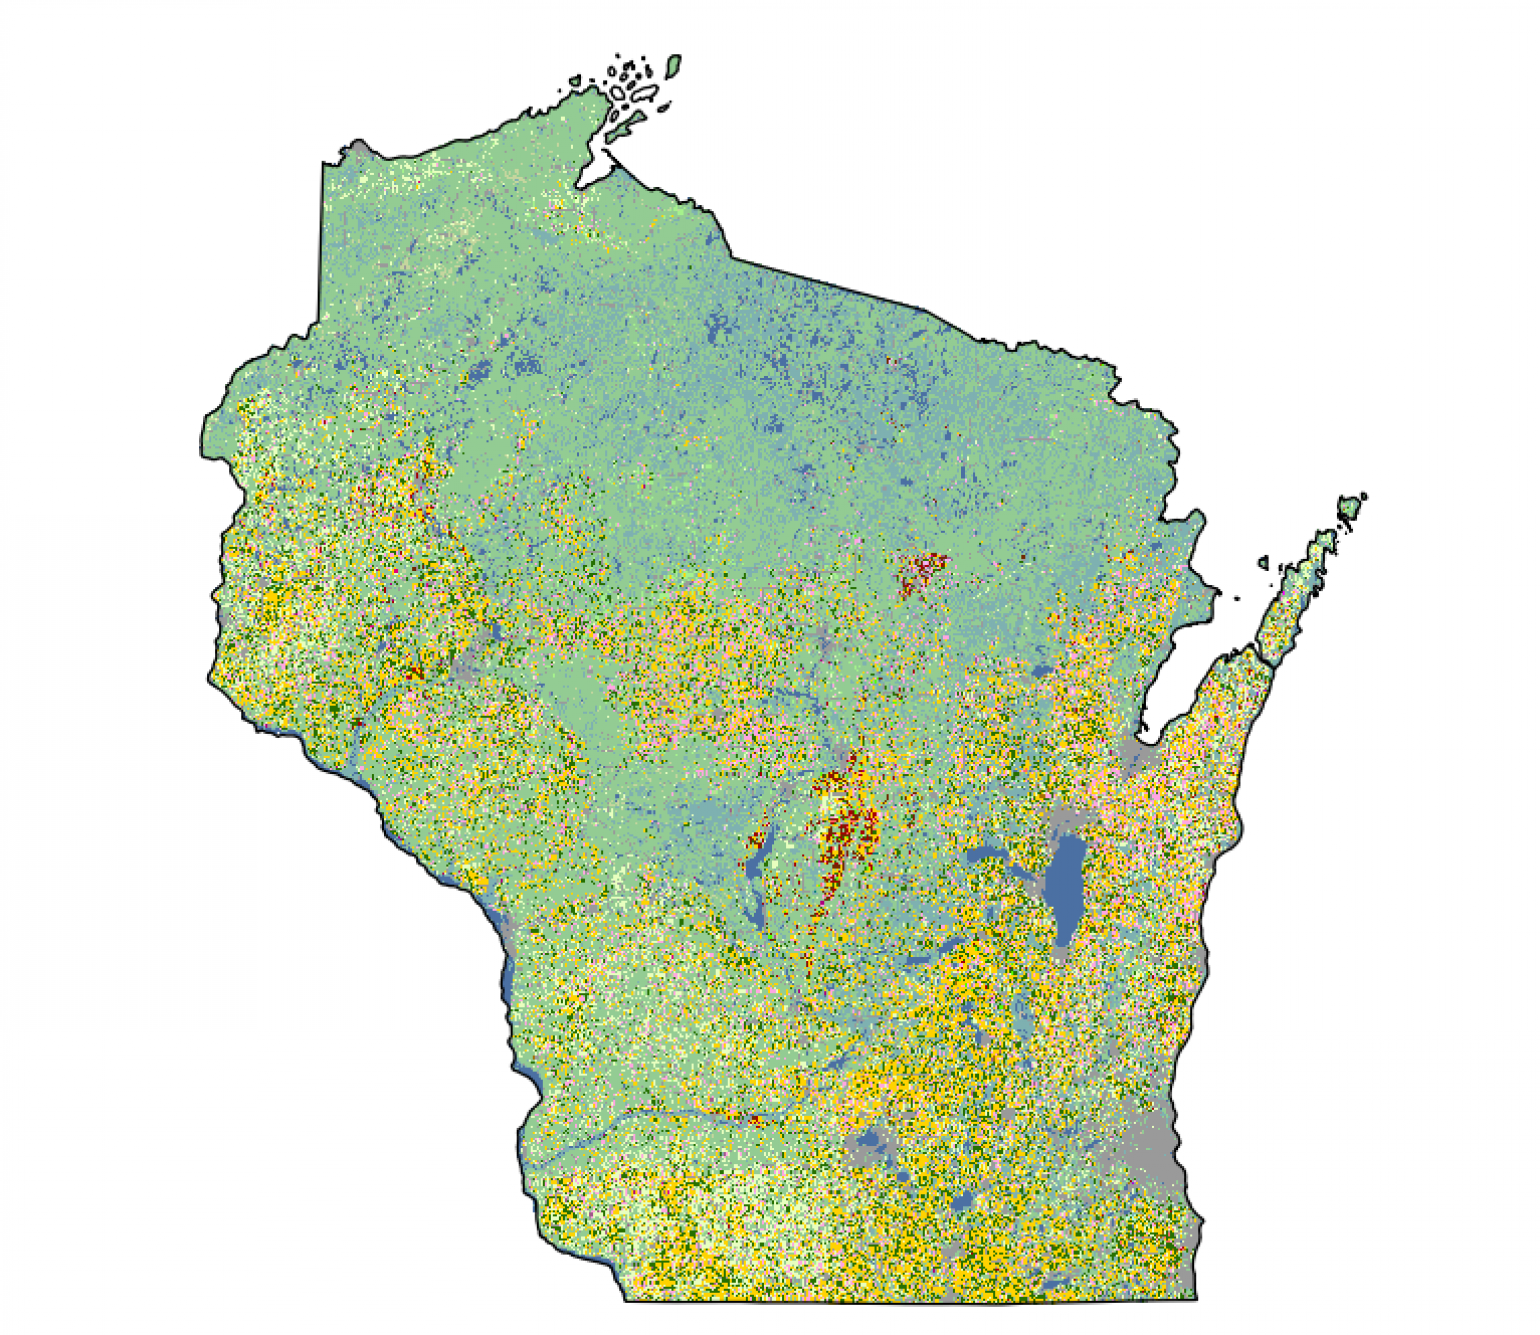
The results of this work are maps that can help track large-scale trends in global and local agriculture.
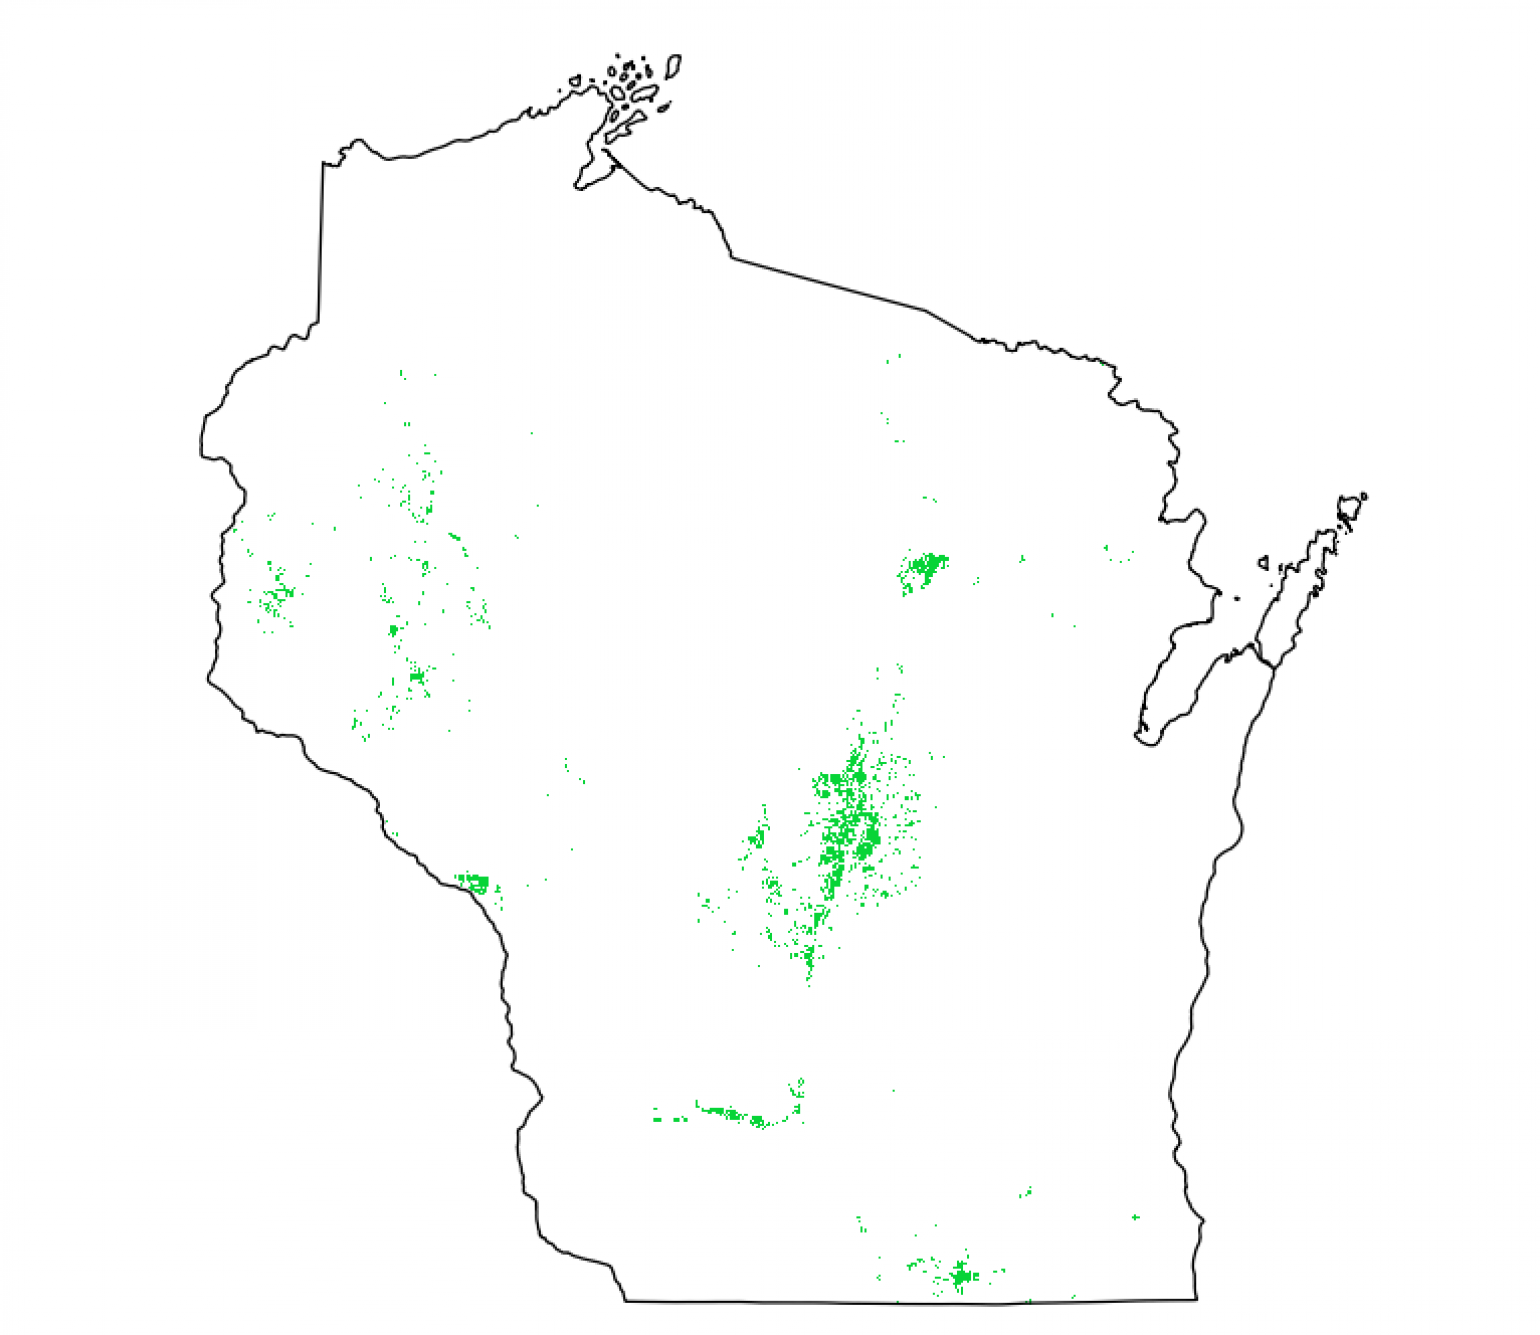
Among the functions Özdoğan's team and others have developed are the ability to map crop types, their estimated yield and whether crops are irrigated — an increasingly important variable as the world's freshwater resources are placed under ever more pressure. Nearly 80% of the globe's freshwater is used for agricultural purposes. In Wisconsin, irrigation maps highlight regions well-known for their irrigation use, such as the Central Sands, but also smaller areas such as one along the Wisconsin River valley around Spring Green.
In addition to tracking long-term trends in agriculture, the Landsat-based imagery can also keep tabs on crop progress during individual growing seasons. These data can help researchers and policymakers more precisely account for the effects of poor planting and growing conditions, like those experienced by farmers in Wisconsin and the upper Midwest in 2019. This information could be useful for helping farmers be more resilient to changing growing conditions in the future.
"Agriculture has great data needs," Özdoğan said. "I think remote sensing can address some of these needs."