Illustration by Scott Gordon and Kristian Knutsen; district map via UW Applied Population Laboratory

The arguments driving a potentially landmark court case over partisan gerrymandering in Wisconsin may already be outdated.
Argued before the U.S. Supreme Court in October 2017 and due for a decision by June 2018, the lawsuit Gill v. Whitford centers around several different mathematical formulas that attempt to quantify the effects of redistricting on voters' rights in a representative democracy. One prominent aspect of the case is a concept called the the efficiency gap, which quantifies the difference between the partisan makeup of the popular vote and the partisan makeup of the winning candidates across a number of legislative districts. Those ballots cast that do not contribute to the election of a given candidate are known as "wasted votes," with that figure and the total number of votes used to calculate the efficiency gap figure.
The creators of the efficiency gap propose a formula that determines whether a party's candidates received more wasted votes in a given legislative election. If votes for one party's candidates are wasted to a level that sufficiently exceeds another's, that may be evidence that partisan gerrymandering has gone too far. Proponents of the efficiency gap test aren't necessarily saying it should be impossible for one party or another to have an advantageous map of legislative districts — they're saying there's a measurable point at which maps are so skewed that they make competitive elections impossible and violate the principle of one person, one vote.
However, the Supreme Court has generally held that politically-motivated gerrymandering is constitutional, as long as it's not racially discriminatory. While justices have at times inveighed against it, the Court has no standard for intervening when a district map merely creates a partisan advantage. Justice Anthony Kennedy, who plays an instrumental role as a swing vote on the court, has hinted in previous cases that he'd be open to a partisan-oriented standard. But as of 2017, nothing in the case law even offers justices a road map for determining when a party has gone too far in redistricting to its own advantage. Formulas like the efficiency gap are one response to this challenge.
Among a community of mathematicians who coalesced around catching and curbing partisan gerrymanders, the efficiency gap has already taken a backseat.
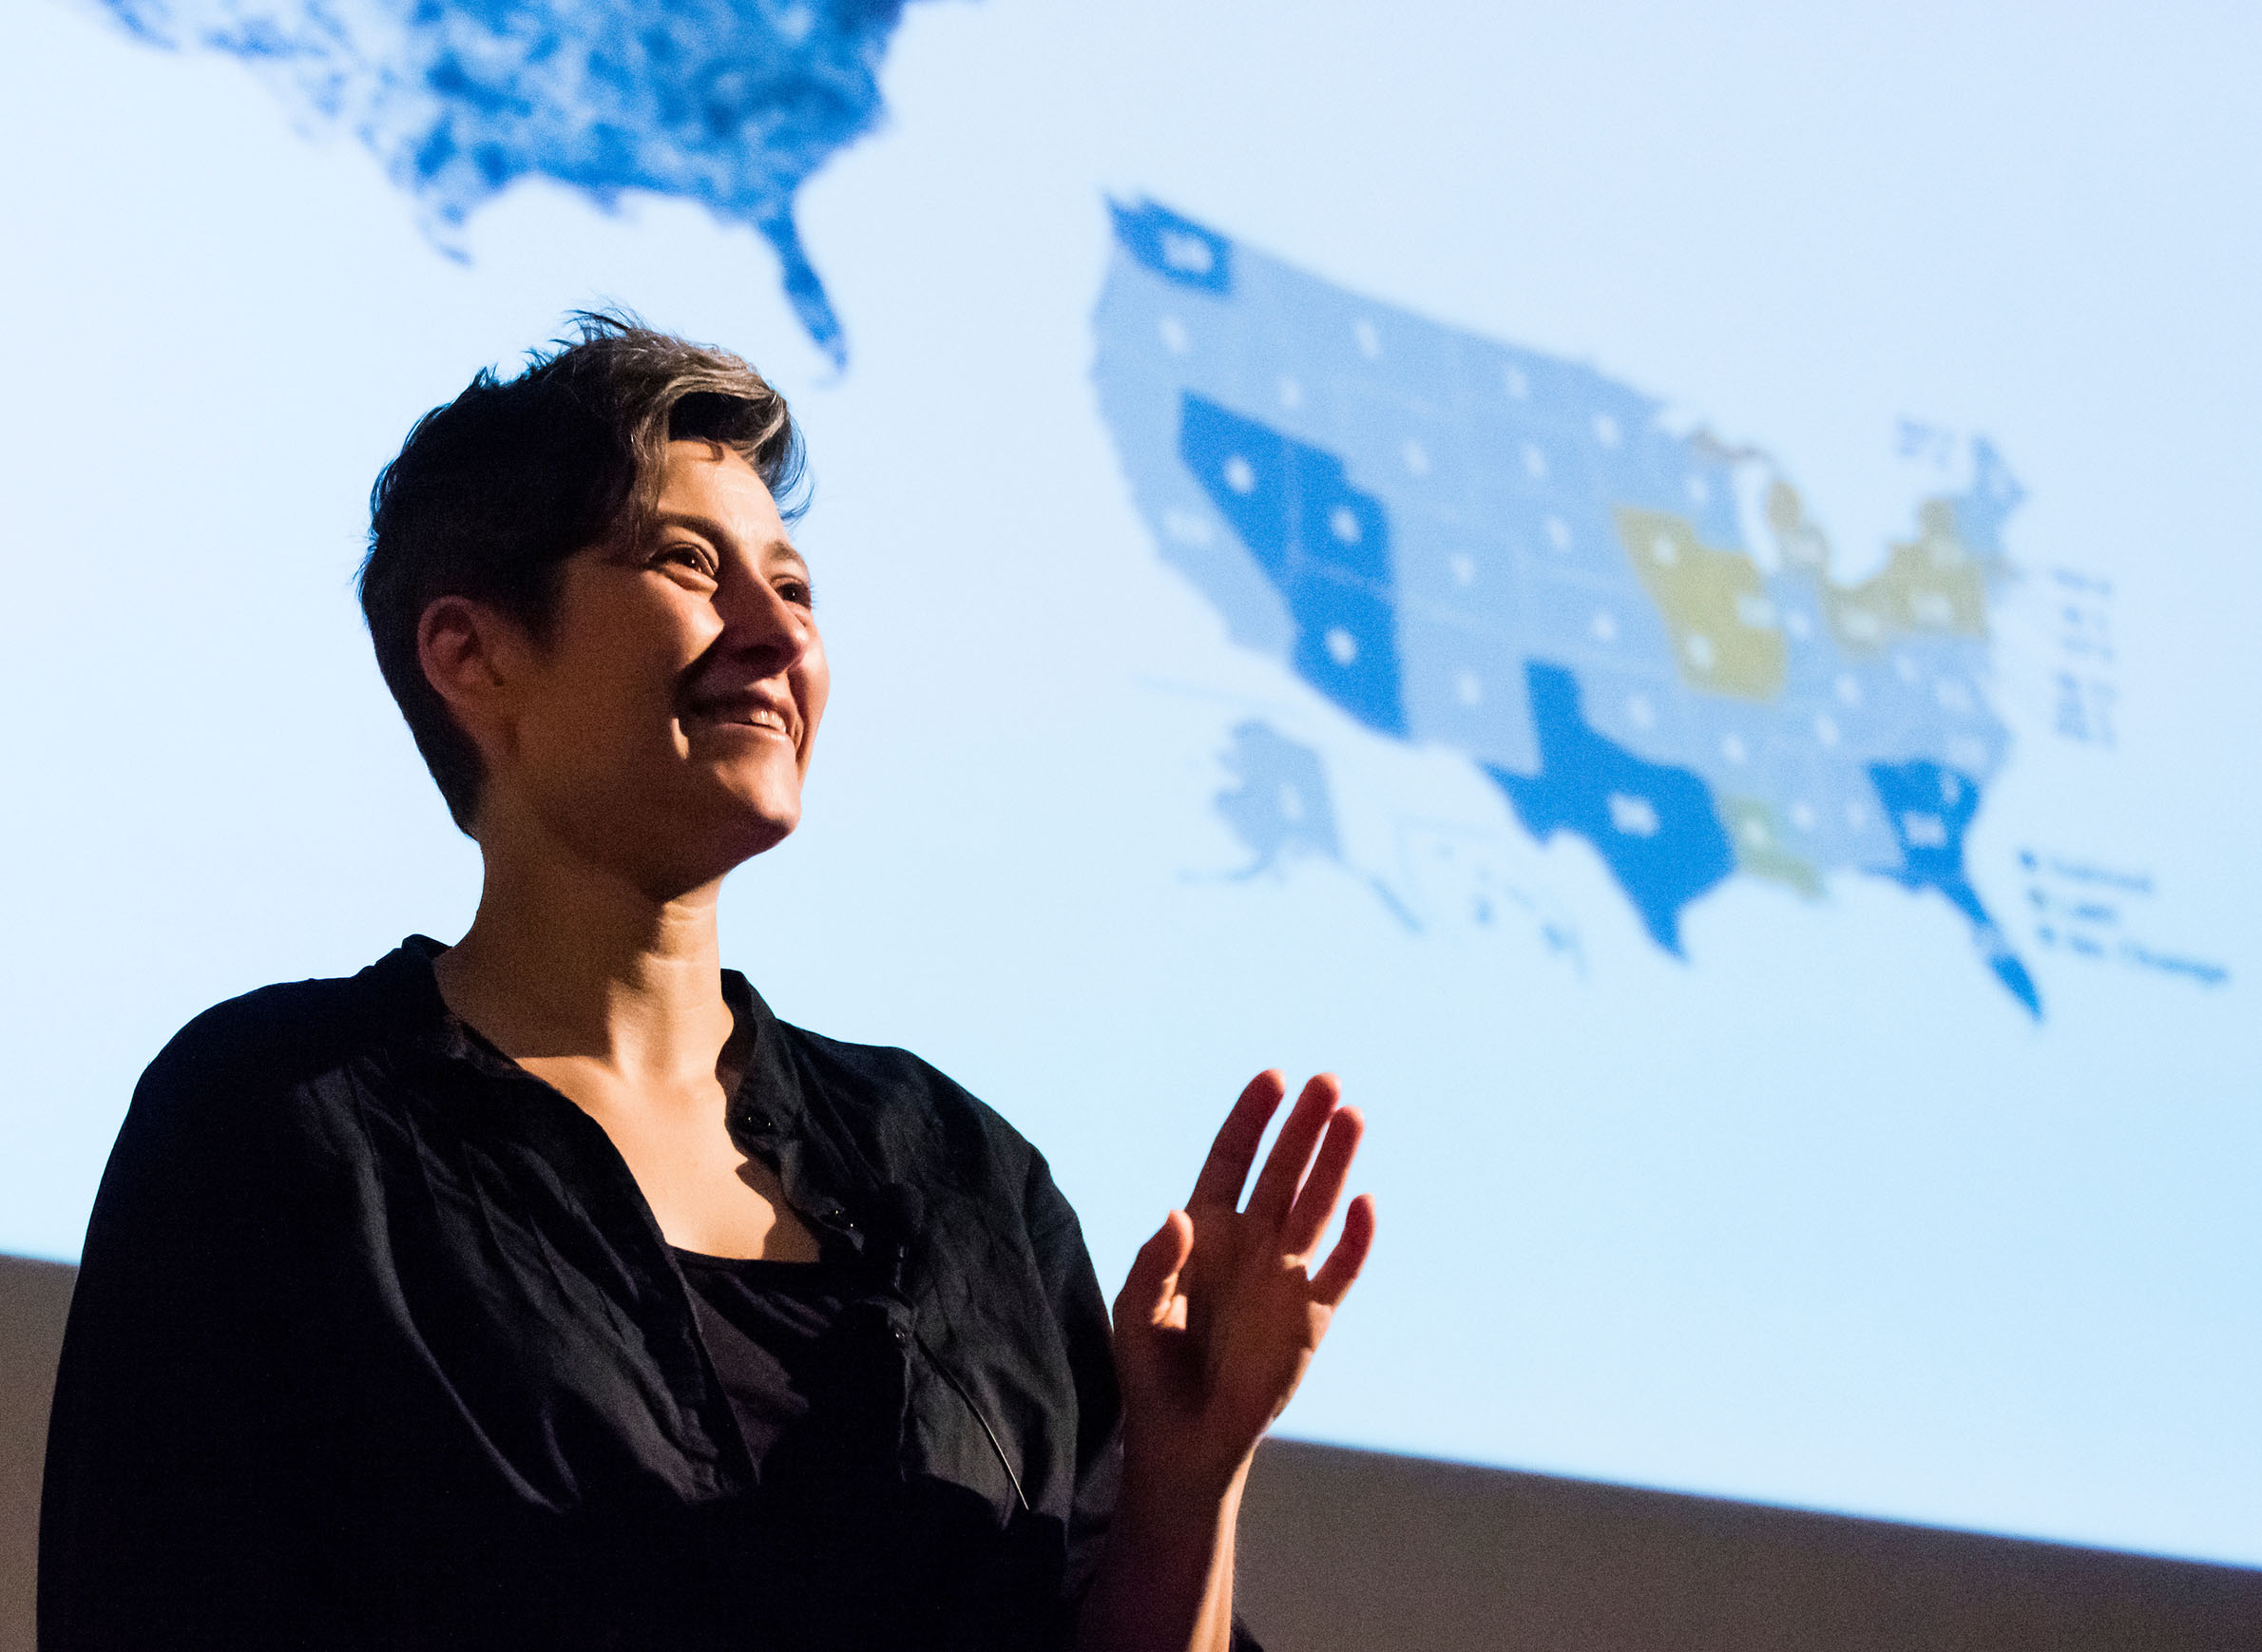
Moon Duchin is a Tufts University mathematics professor who has played an instrumental role in organizing that community through her own research and an ongoing series of conferences. She respects the scholarship behind the efficiency gap, but also sees the formula as limited.
"I think that the efficiency gap is doing about as good as a job as possible at capturing everything in one number, but that's where I think the problem is," Duchin said.
Calculating the efficiency gap for a given legislative map will yield a score, but for Duchin and her peers, "gerrymandering is just too rich," mathematically speaking, to be boiled down that simply.
"I would argue that Whitford was off by one year from the computer sampling revolution," Duchin said, referring to the rise of a different approach in gerrymandering research. "Which is such a bummer because we waited 30 years for a big partisan case to go up before the Supreme Court."
Jordan Ellenberg, a University of Wisconsin-Madison math professor, co-organized one of Duchin's conferences in Madison in October 2017, and has written a New York Times op-edon the science of gerrymandering. He sees a high efficiency gap as a "red flag." But he doesn't see the test as a basis for a constitutional standard that guides when courts can send state legislators back to the drawing board.
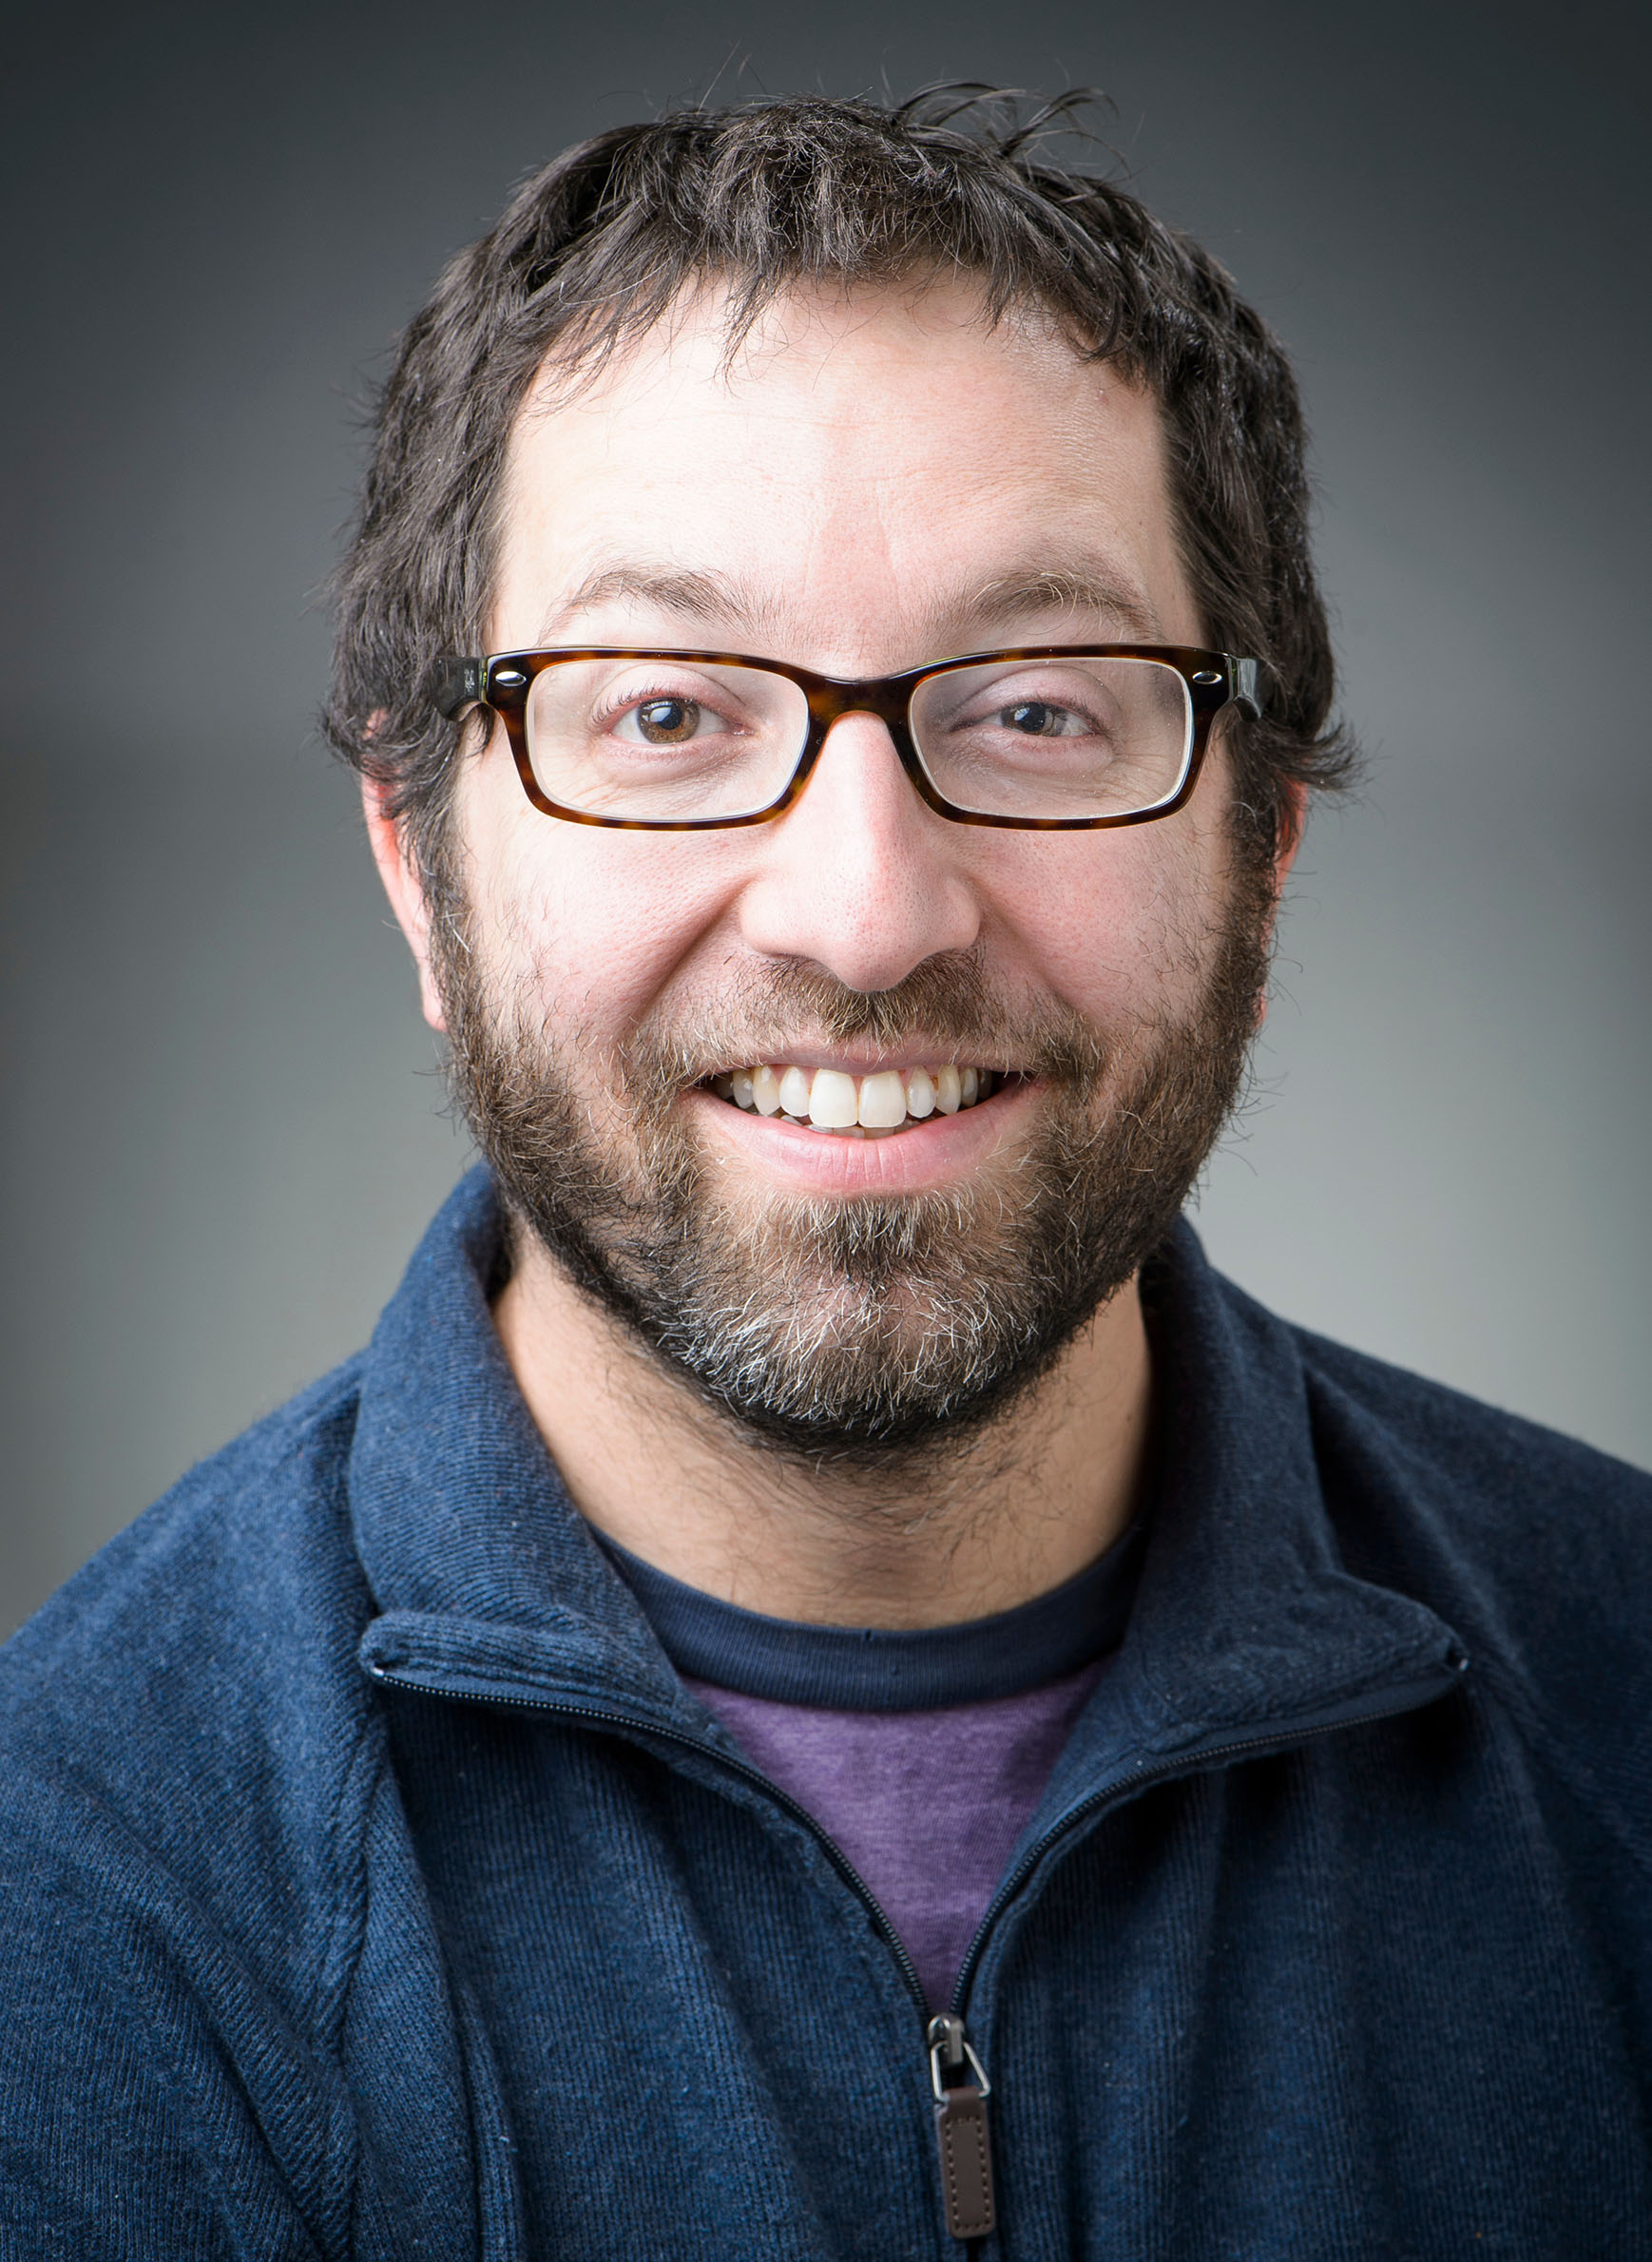
"It would not be a good idea to impose or advocate a legal standard where if your efficiency gap is above a certain threshold, that's unconstitutional," Ellenberg said.
One of the efficiency gap's toughest critics is Wendy K. Tam Cho, a University of Illinois political science professor with a particular interest in statistical and mathematical models. In a July 2017 essay for the University of Pennsylvania Law Review, she broke down how the efficiency gap falls short in its attempt to measure electoral unfairness on partisan grounds.
The efficiency gap test measures all votes cast for losing candidates as wasted, as well as all votes for winning candidates beyond the number needed to ensure a majority, and in the exact same way.
"In the efficiency gap measure, both excess winning votes and losing votes are considered the same, but waste needs to be defined by its context," Cho wrote.

Because the efficiency gap test equates different kinds of waste, it can perversely reflect well on a district map that's in fact politically skewed. In an email interview, Cho explained the problem this way: "If Republicans win a district 75 percent to 25 percent, then the Republicans have wasted 25 percent and the Democrats have wasted 25 percent. This would be deemed optimal by the efficiency gap because both parties waste the same number of votes. A situation where a district is that lopsided is clearly not optimal."
Another objection Cho makes is that the efficiency gap tries to factor in the underlying partisan composition of the population, though partisanship is a mutable characteristic with no set definition. A registered Republican or Democrat won't always follow the party line ideologically and won't always vote strictly along party lines, so measuring by party preference doesn't cut it, she says. One could define a district or precinct or state's partisan measure based on how it voted in a previous congressional or presidential election, but those votes can swing, sometimes dramatically so. Plus, as Cho points out, being fair to political parties is a very different thing from being fair to the electorate.
Legislative redistricting combines principles of geometry and demographics, so the practice does lend itself to quantifying outcomes in order to determine fairness. Mathematicians and political scientists have worked in the past to understand, for instance, the compactness of districts and this factor's role in elections. A geographically contorted district clearly is not compact, but is it possible to measure how compact it is compared to how compact it could be? Is it proportional? Is it representative? Does it keep communities of interest intact?
Moon Duchin and other scholars who study the math of redistricting want to develop better methods for understanding gerrymandering and drawing fairer maps. One goal of Duchin's conferences is to equip more academics to serve as expert witnesses in a flurry of redistricting lawsuits that shows no signs of abating. These mathematicians are talking about the efficiency gap, but they're thinking much more about an entirely different approach to detecting excessive partisan gerrymanders.
A plaintiff challenging a partisan gerrymander in court could use a calculation like the efficiency gap to argue that a legislative district map puts a certain group of voters at an unfair disadvantage. Or the plaintiff could use software to generate dozens or thousands or even millions of possible legal ways to draw that map, and place the existing one within the vast continuum of options. Researchers who advocate for this method call it the "sampling" approach.
Rather than put a number on how politically skewed a district map is, sampling places that map within the context of a bunch of different possibilities.
"What [sampling is] good at is telling you if one proposed plan is way out of whack with the rest of the alternatives," Duchin said.
She sees an emerging consensus among gerrymandering-focused mathematicians that the best approach is to construct algorithms using what's known as Markov chain Monte Carlo methods to generate massive numbers of legislative district maps with minor variations between them, while also accounting for already established legal constraints and generally agreed upon qualities that district maps should have.
Computing power has made gerrymandering far more sophisticated and politically effective, with people who seek to carve up specific portions of the electorate to their own advantage already benefiting from such advances. The stage legislatures that undertook redistricting after the 2010 Census had access to sophisticated mapping software of a kind that just hadn't existed in previous cycles. Such software can use not only Census data to draw potential districts, but can also factor in other demographic or political data, enabling those in power to fine-tune their maps for optimal advantage while still obeying the letter of the law.
A majority party drawing new districts to give itself political advantage might have a lot of complex data to take into account, but it ultimately only needs to come up with one map, not thousands. Perhaps the power of computing can also be used to check lawmakers who try to pick their voters too selectively. And this approach will indeed require tremendous amounts of computing power.
"If you think about it in terms of all the choices that you make when you're drawing a districting map, it's an unthinkable more than astronomical number of choices for how to take a state like Wisconsin and take its wards and divides them up into districts. You can't even think about the space of all the possibilities," Duchin said in an Oct. 3, 2017 interview with Wisconsin Public Radio's Central Time.
The conversation around sampling didn't really reach a critical mass until Gill v. Whitford was already up and running through the court system, so it was not and won't be much help to the Wisconsinites challenging a the redistricting at issue in that case.
In court, scholars can cross-reference batches of sampled maps with voting data to show what election outcomes they might likely yield, and where the challenged map fits into the continuum of possible outcomes. A group of researchers at Duke University did exactly this to understand how the Wisconsin Assembly district maps the state created in 2011 Act 43 may have altered election results and by extension the balance of power in the state.
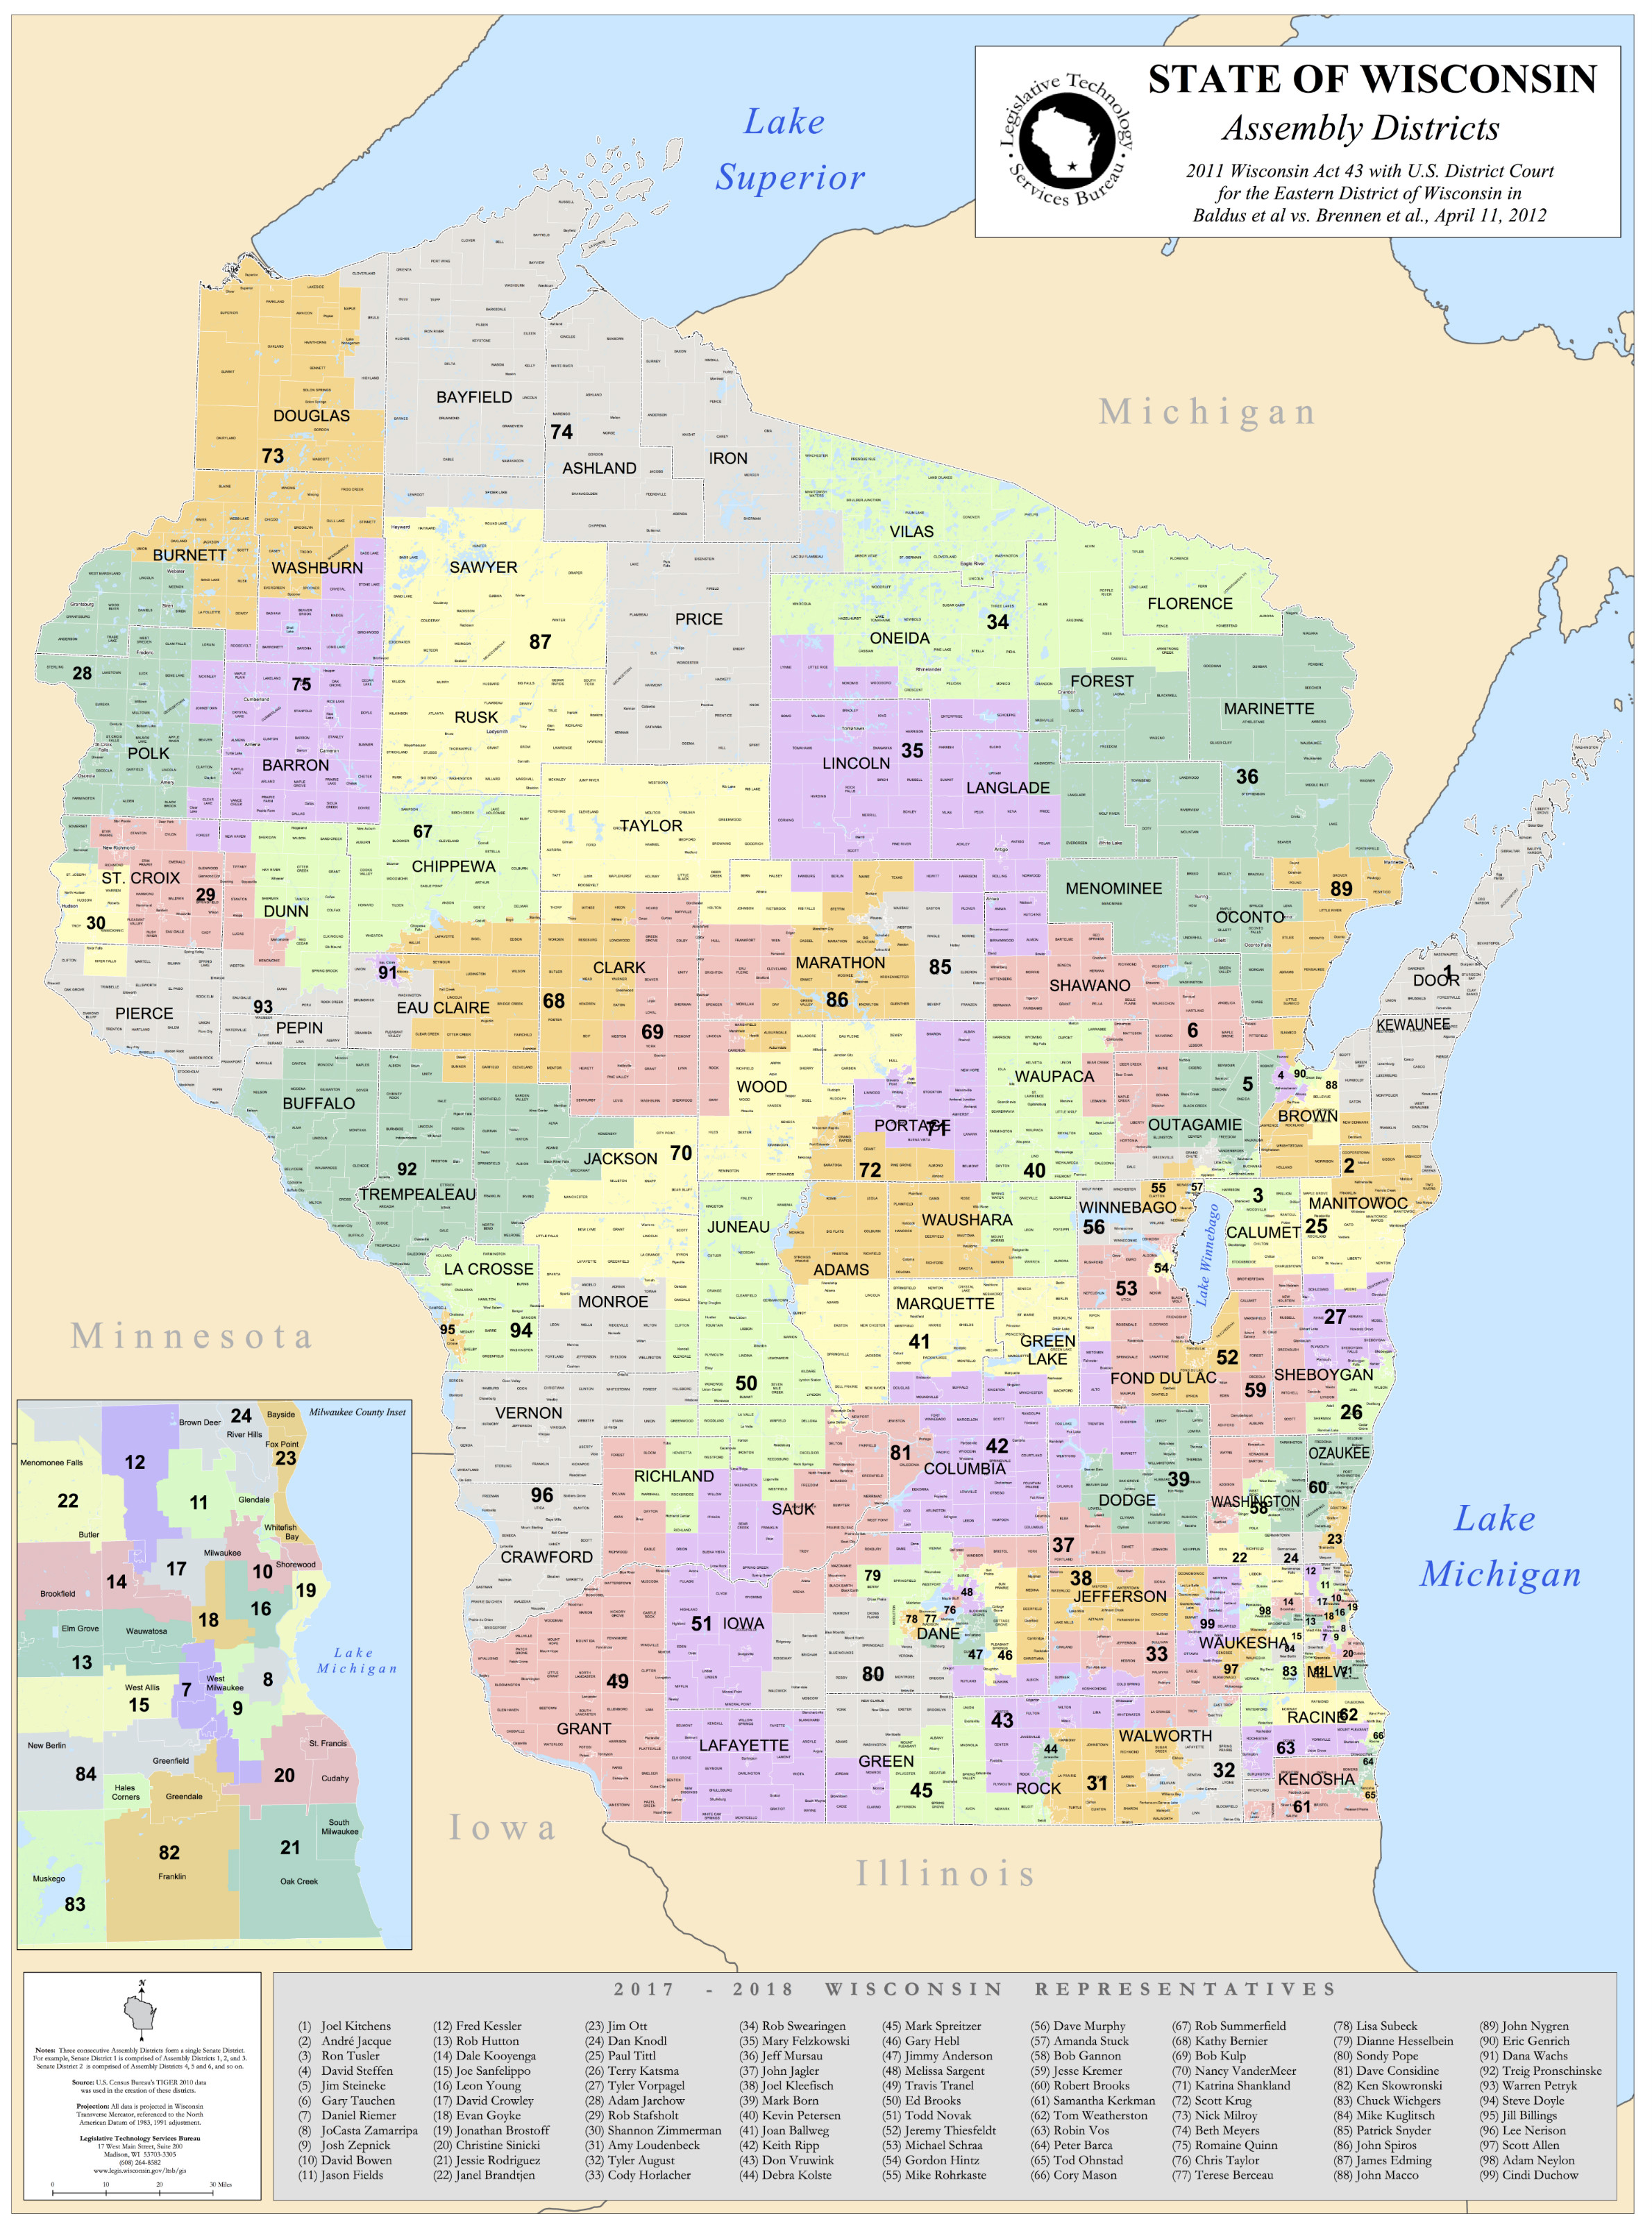
"What'll happen out of those millions of possibilities is you'll get a bell curve that shows all the diff ways it could turn out," said Moon Duchin on Central Time. "And then you look at Act 43, at the current assembly plan, and you'll see it's all the way out on the tail of the bell curve. It's not in the fat part, it's an outlier."
This observation reflects what Duke University researcher Jonathan Mattingly and colleagues found in a September 2017 paper that used sampling to compare Wisconsin's post-2011 Assembly district maps with nearly 20,000 other possibilities. By cross-referencing every potential map with votes in several recent state legislative elections, Mattingly found that the current Assembly districts favor Republican candidates much more strongly than most other possible maps.
Researchers using voting numbers from previous elections are also working on ways to account for the fact that some elections are uncontested, and that the specific demographics and partisan leanings of districts will affect the makeup of candidates and parties' strategies in specific races. But even with these factors in mind, Mattingly believes his work shows that gerrymandering in and of itself can play a demonstrable role in shifting election outcomes and therefore the partisan composition of legislatures.
"Let me say this with big stars around it: one disturbing thing to me is how much the outcomes shift just by drawing reasonable maps," Mattingly said. "If an equally deciding factor is how the maps were drawn to who voted and how, it does give me pause."
In addition to analyzing the Wisconsin Assembly districts, Mattingly has testified in a North Carolina gerrymandering lawsuit that has some parallels to Gill.
"Some people want to ask, well, are we really simulating alternate realities?" he said. "In some sense, whenever somebody asks you to do diagnostics, what they're really asking you to do is compare this reality to some other reality."
By using voting data from actual elections, available demographic data, and relevant legal constraints on redistricting, Mattingly and other sampling practitioners try to hew as close to reality as they can in such an exercise.
University of Illinois political scientist Wendy K. Tam Cho has been using the school's Blue Waters supercomputer to develop a highly sophisticated map-sampling algorithm called PEAR.
"I think what is important, especially for the mathematicians, is that applying math usefully and well to this problem requires a depth of domain knowledge," said Cho. "If people are serious about working on the problem, they should spend the time to learn the case law, how court cases work, understand the history, learn about the political process, et cetera. There are many moving parts here."
Advocates of sampling are not proposing that states adopt computer-generated district maps. State legislatures have the constitutional authority to draw maps as they see fit, within the bounds of case law and both state and federal statutes.
Duchin and her colleagues also respect the fact that redistricting often must factor in messy political and other human factors. For instance, in some states, drawing maps to provide a certain degree of protection to incumbents is considered entirely legitimate. Voters of one ideological bent or another are often clustered together, like left-leaning voters in big cities, so a district drawn to be compact may not be competitive in a strictly partisan sense. And sometimes there's a statutorily defined reason for a strangely shaped district — Illinois' 4th Congressional district, often dubbed the "earmuffs" district, is drawn to ensure that Chicago's large but geographically dispersed Latin American population is represented in a majority district. Even the most sophisticated algorithm paired with the mightiest supercomputer cannot generate a one-size-fits-all approach.
"There's no legal or historical basis for taking the power to draw maps away from the legislature," Duchin said. "It's not how we do elections. But giving them some sort of guardrail or guideline — that's completely legitimate, or well within the purview of the courts as we've seen when one person one vote was articulated."
The hope of mathematicians who research gerrymandering is that sampling can take more specific conditions into account , because it's more flexible than a purely abstract score like the efficiency gap. An algorithm powerful enough to create thousands of perfectly legal district maps can also incorporate all sorts of parameters specific to a state and various localities.
The scholars tackling cutting-edge problems related to gerrymandering also expect a lot of tough questions from the courts as more plaintiffs use sampling to challenge legislative maps. Duchin anticipates that because the number of possible redistricting maps in a given state is astronomically large, a judge might reasonably ask whether a sample of, say, 20,000 is really all that representative of the acceptable possibilities.
"That's a pretty good question mathematically and legally, and I hope that's the level of debate that we see in the courts," Duchin said.