Mathematicians Wield Data To Slay The Partisan Gerrymander

Politicians have been drawing legislative districts to help ensure their desired outcomes for as long as representative democracy has existed. However, this practice of gerrymandering to help a ruling political party maintain control is getting even more entrenched. More specifically, it’s getting easier to gerrymander effectively due to the improving ability of consumer research data to predict voter behavior coupled with the increasing power of computerized mapping programs.
Advances in data and technology were instrumental in redrawing Wisconsin's legislative districts in 2012. Developed by the state legislature's Republican majority in concert with a law firm it hired, these maps were identified by a three-judge federal court panel as a key factor in affecting the outcomes of ensuing state-level election results. This lawsuit challenging the redistricting, Gill v. Whitford, was argued before the Supreme Court of the United States in October 2017, with a decision expected in 2018.
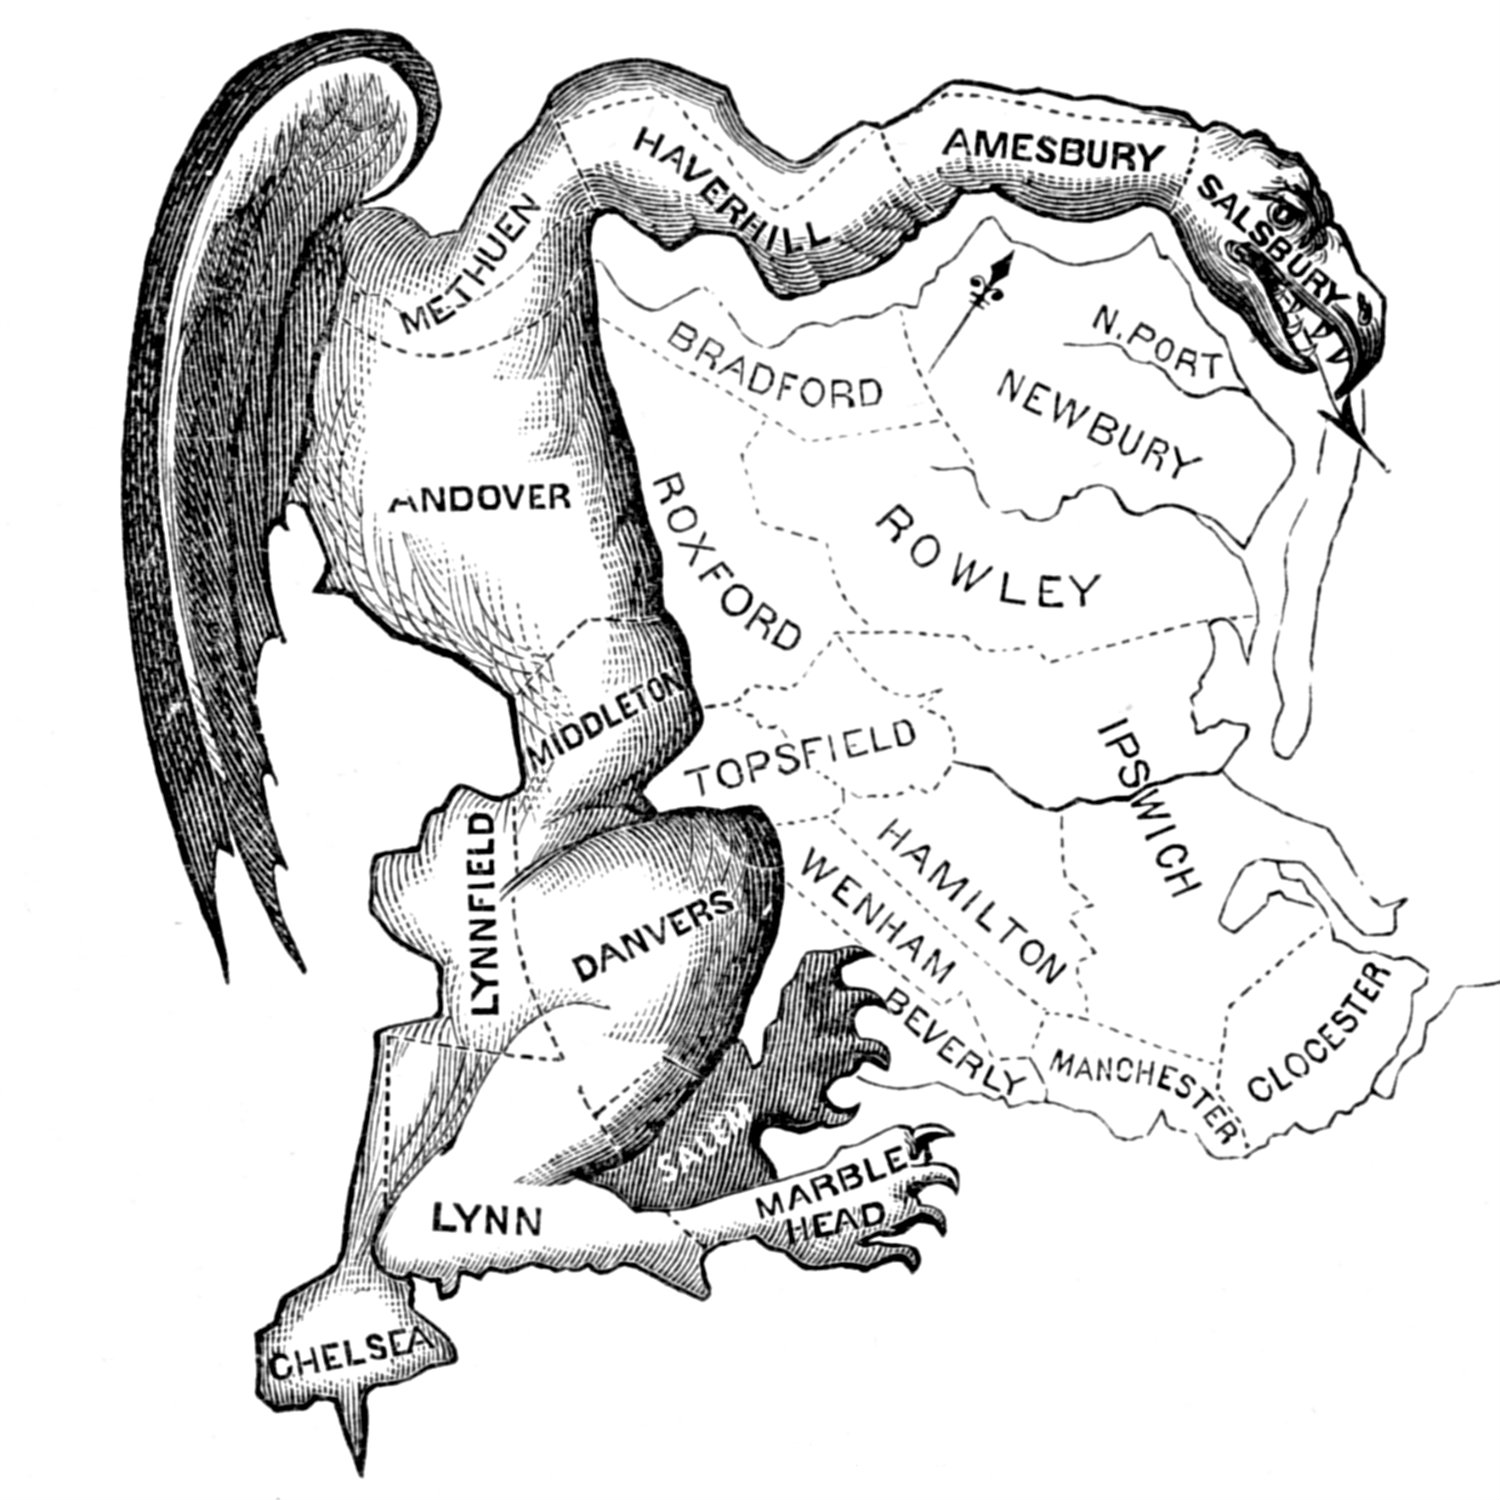
In the age of big data, it is possible to influence election results by drawing district boundaries without producing the bizarre-looking legislative districts which gave "gerrymandering" its name.
In October 2017, Tufts University's nonpartisan Metric Geometry and Gerrymandering Group joined with UW-Madison's Elections Research Center and Department of Mathematics to co-host a four-day conference on the geometry of gerrymandering. The interdisciplinary conference — one of several held across the United States branded with the hashtag #gerrymandr — focused on the complex intersections between population science, math, geography and the law.
The first two days of the conference were open to the public and included lectures on a variety of subjects, including the Gill v. Whitford lawsuit, geometry, computational modeling, and demography. (Disclosure: I gave a presentation at the conference about the constitutional basis of redistricting and the role of U.S. Census data in the redistricting process.) One of the key messages came from Moon Duchin, a Tufts University professor of geometry and conference organizer, who addressed a need for a method to more specifically measure the level of gerrymandering. She suggested comparing existing legislative districts and related voting outcomes to districts drawn by a computer using probabilistic methods.
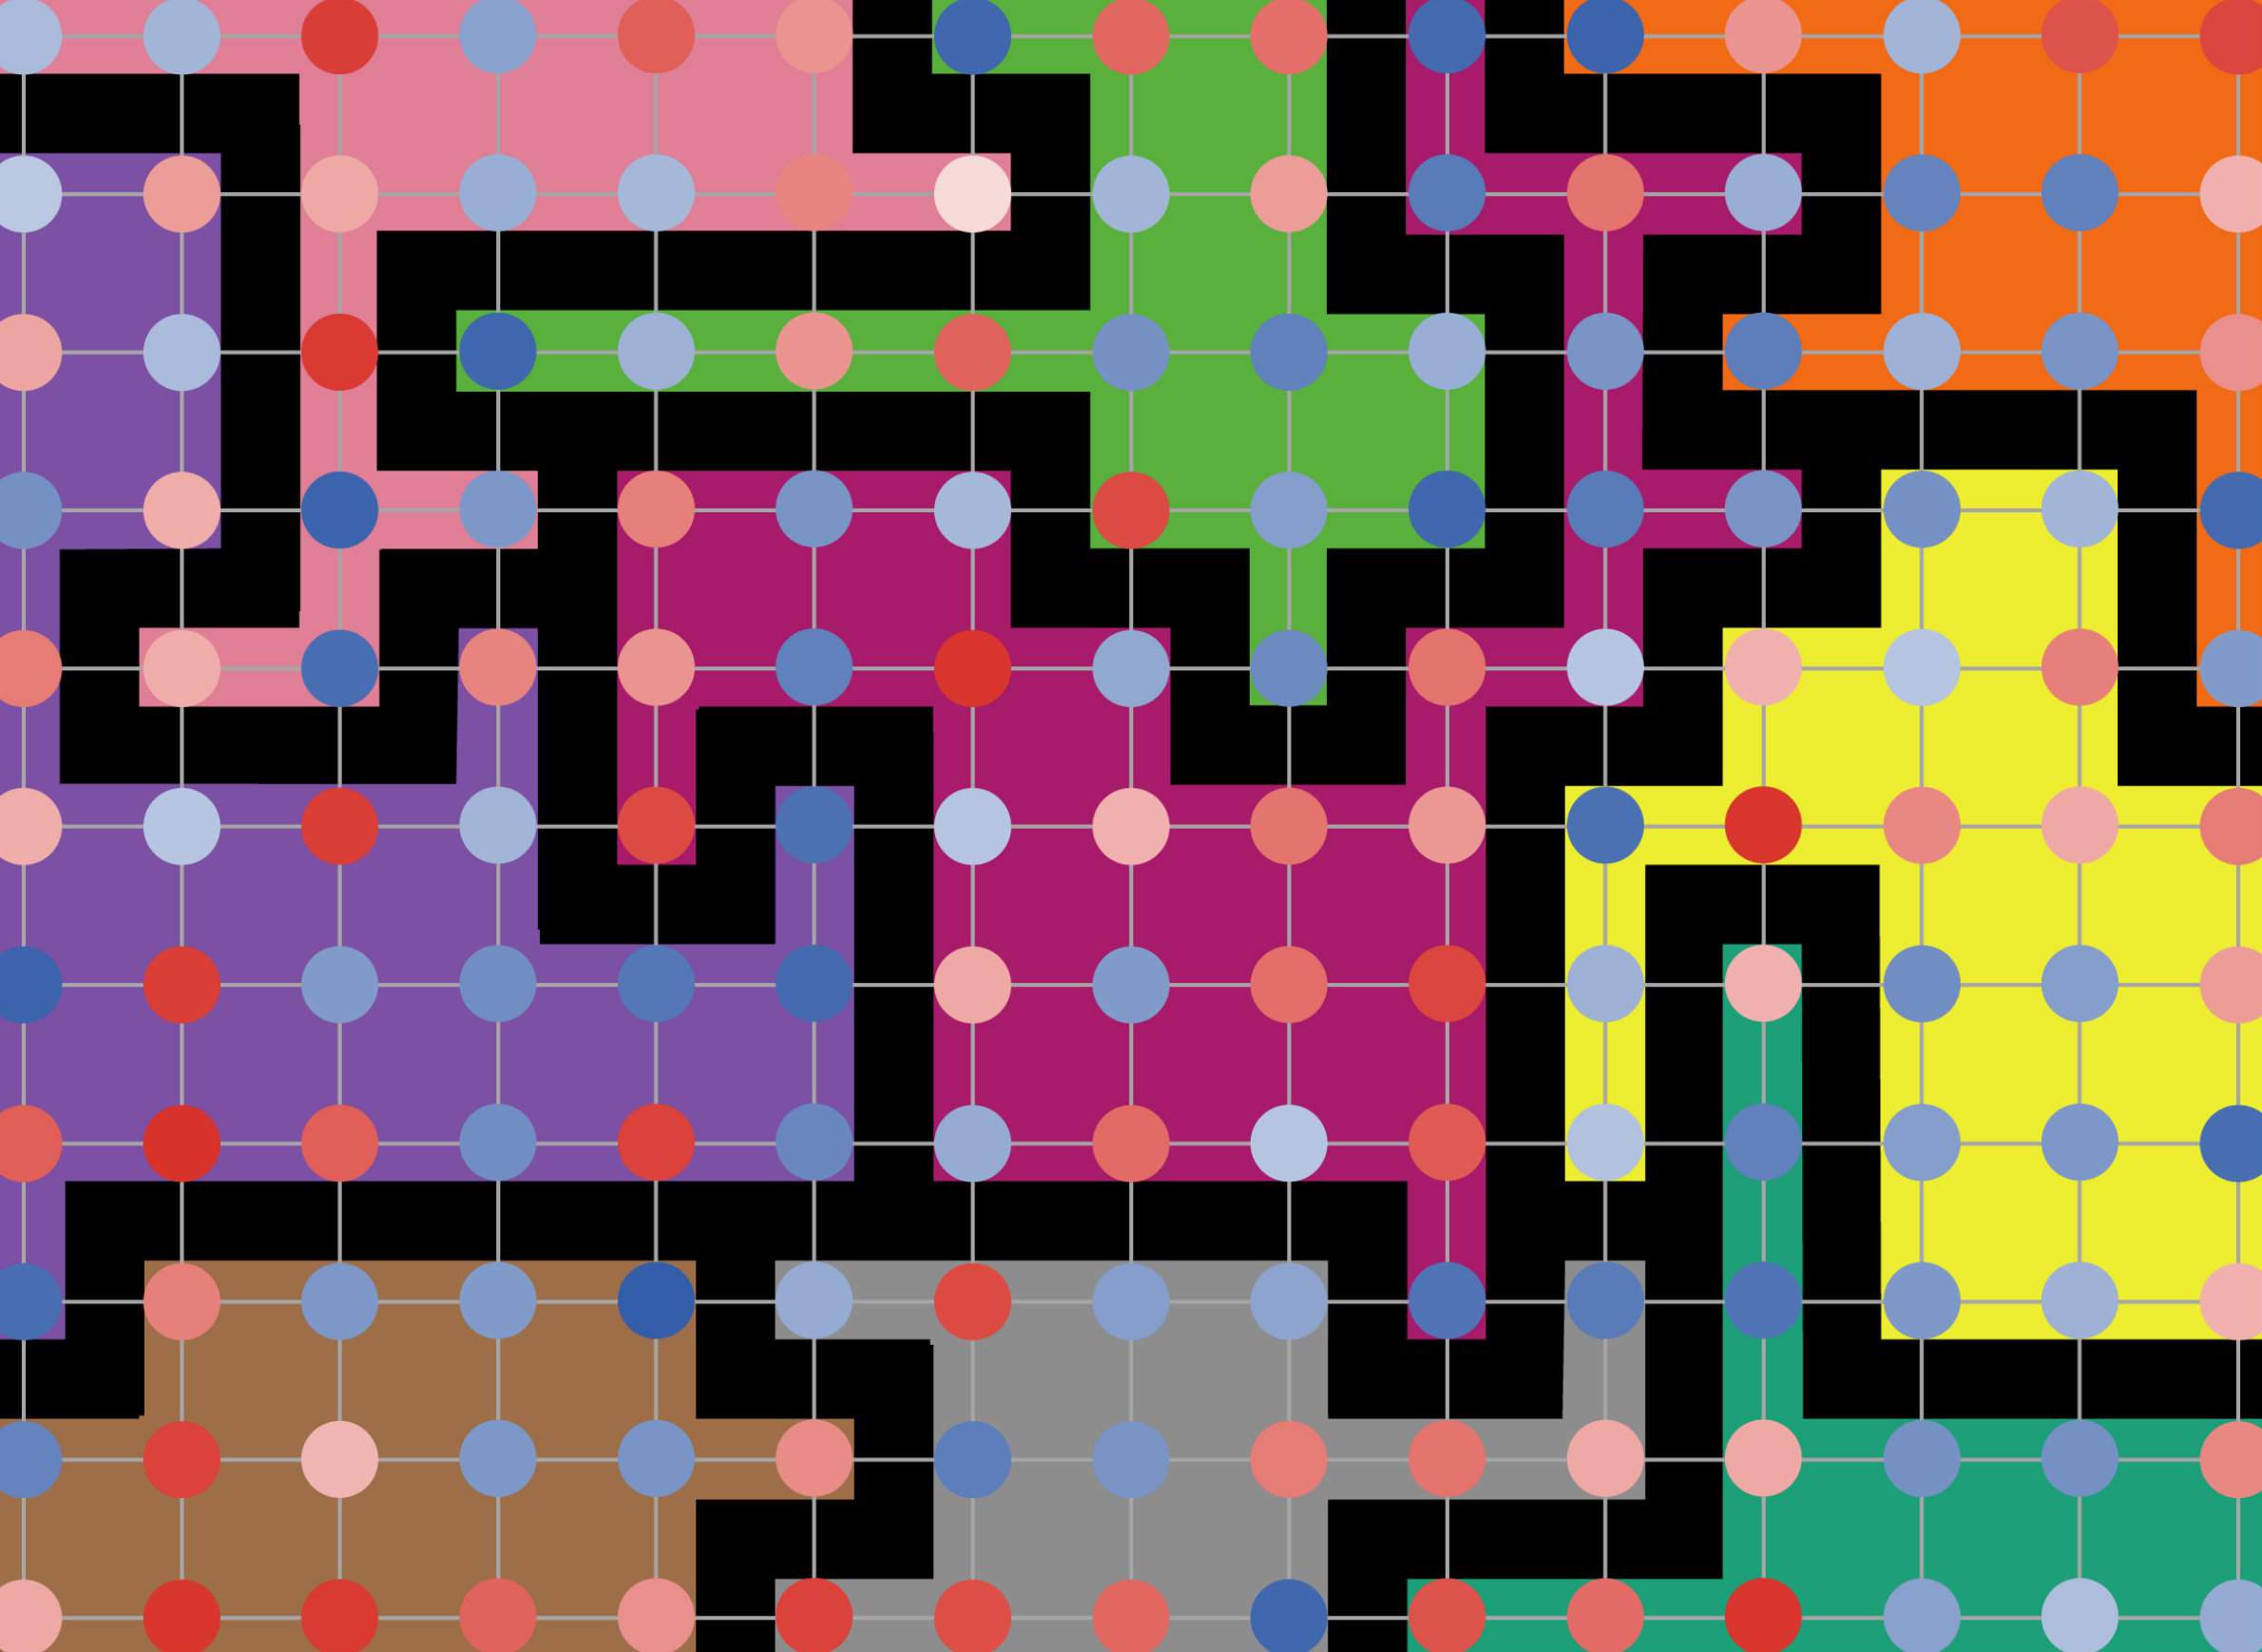
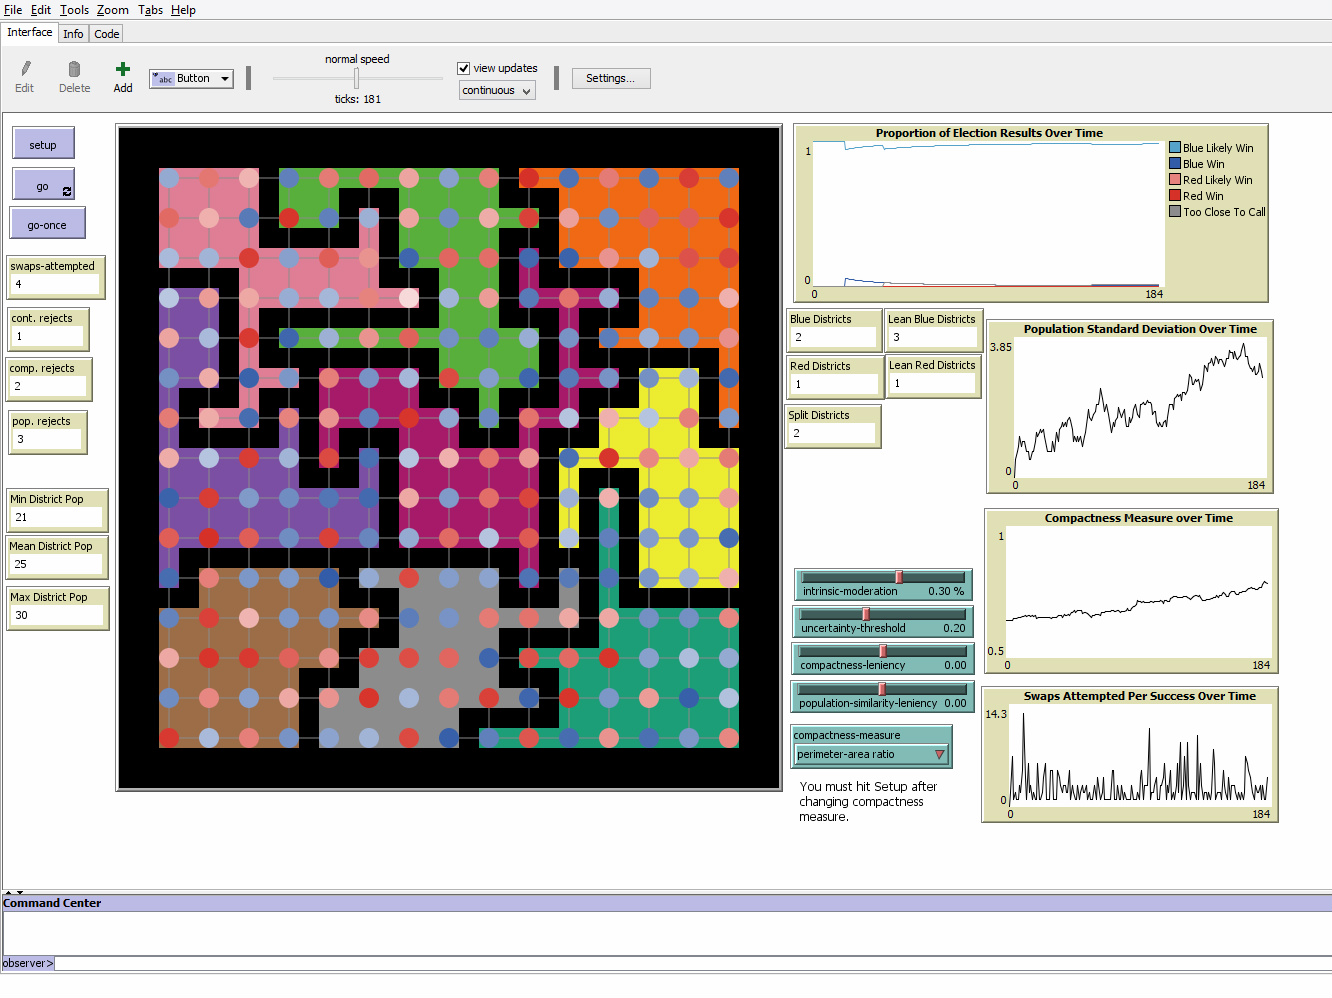
On the third and fourth day of the conference, 16 invited participants convened for a "hackathon." Participants worked solo or in groups to address some of the pressing and emergent computational issues of the field. The tools created by the group include a library of measures related to gerrymandering and fairness for use in analytic software programs, a tool that creates every possible districting map from a given set of census blocks, an R computing program that allows high-school and collegiate students to explore the concept of redistricting within their own communities, and a program to simulate the process of redistricting on a block-by-block basis. This last project allows users to see how gerrymandering emerges and produces different election outcomes under different redistricting guidelines, using a simulated population. These projects are all open-source and available on the #gerrymandr GitHub site.
Tufts' Metric Geometry and Gerrymandering Group is continuing to organize additional workshops around the nation, with sessions planned for Texas and California.
Scientific attention to the technical aspects and tools of legislative redistricting are a significant addition to an already substantial political and media discourse about the subject. With the Gill v. Whitford case under consideration by the Supreme Court, the 2020 decennial census approaching and a new redistricting cycle to follow, gerrymandering will continue be a critical political issue with no clear resolution.


