The polling mark in 2016 may have shifted as it did in 1948.

The polling mark in 2016 may have shifted as it did in 1948.
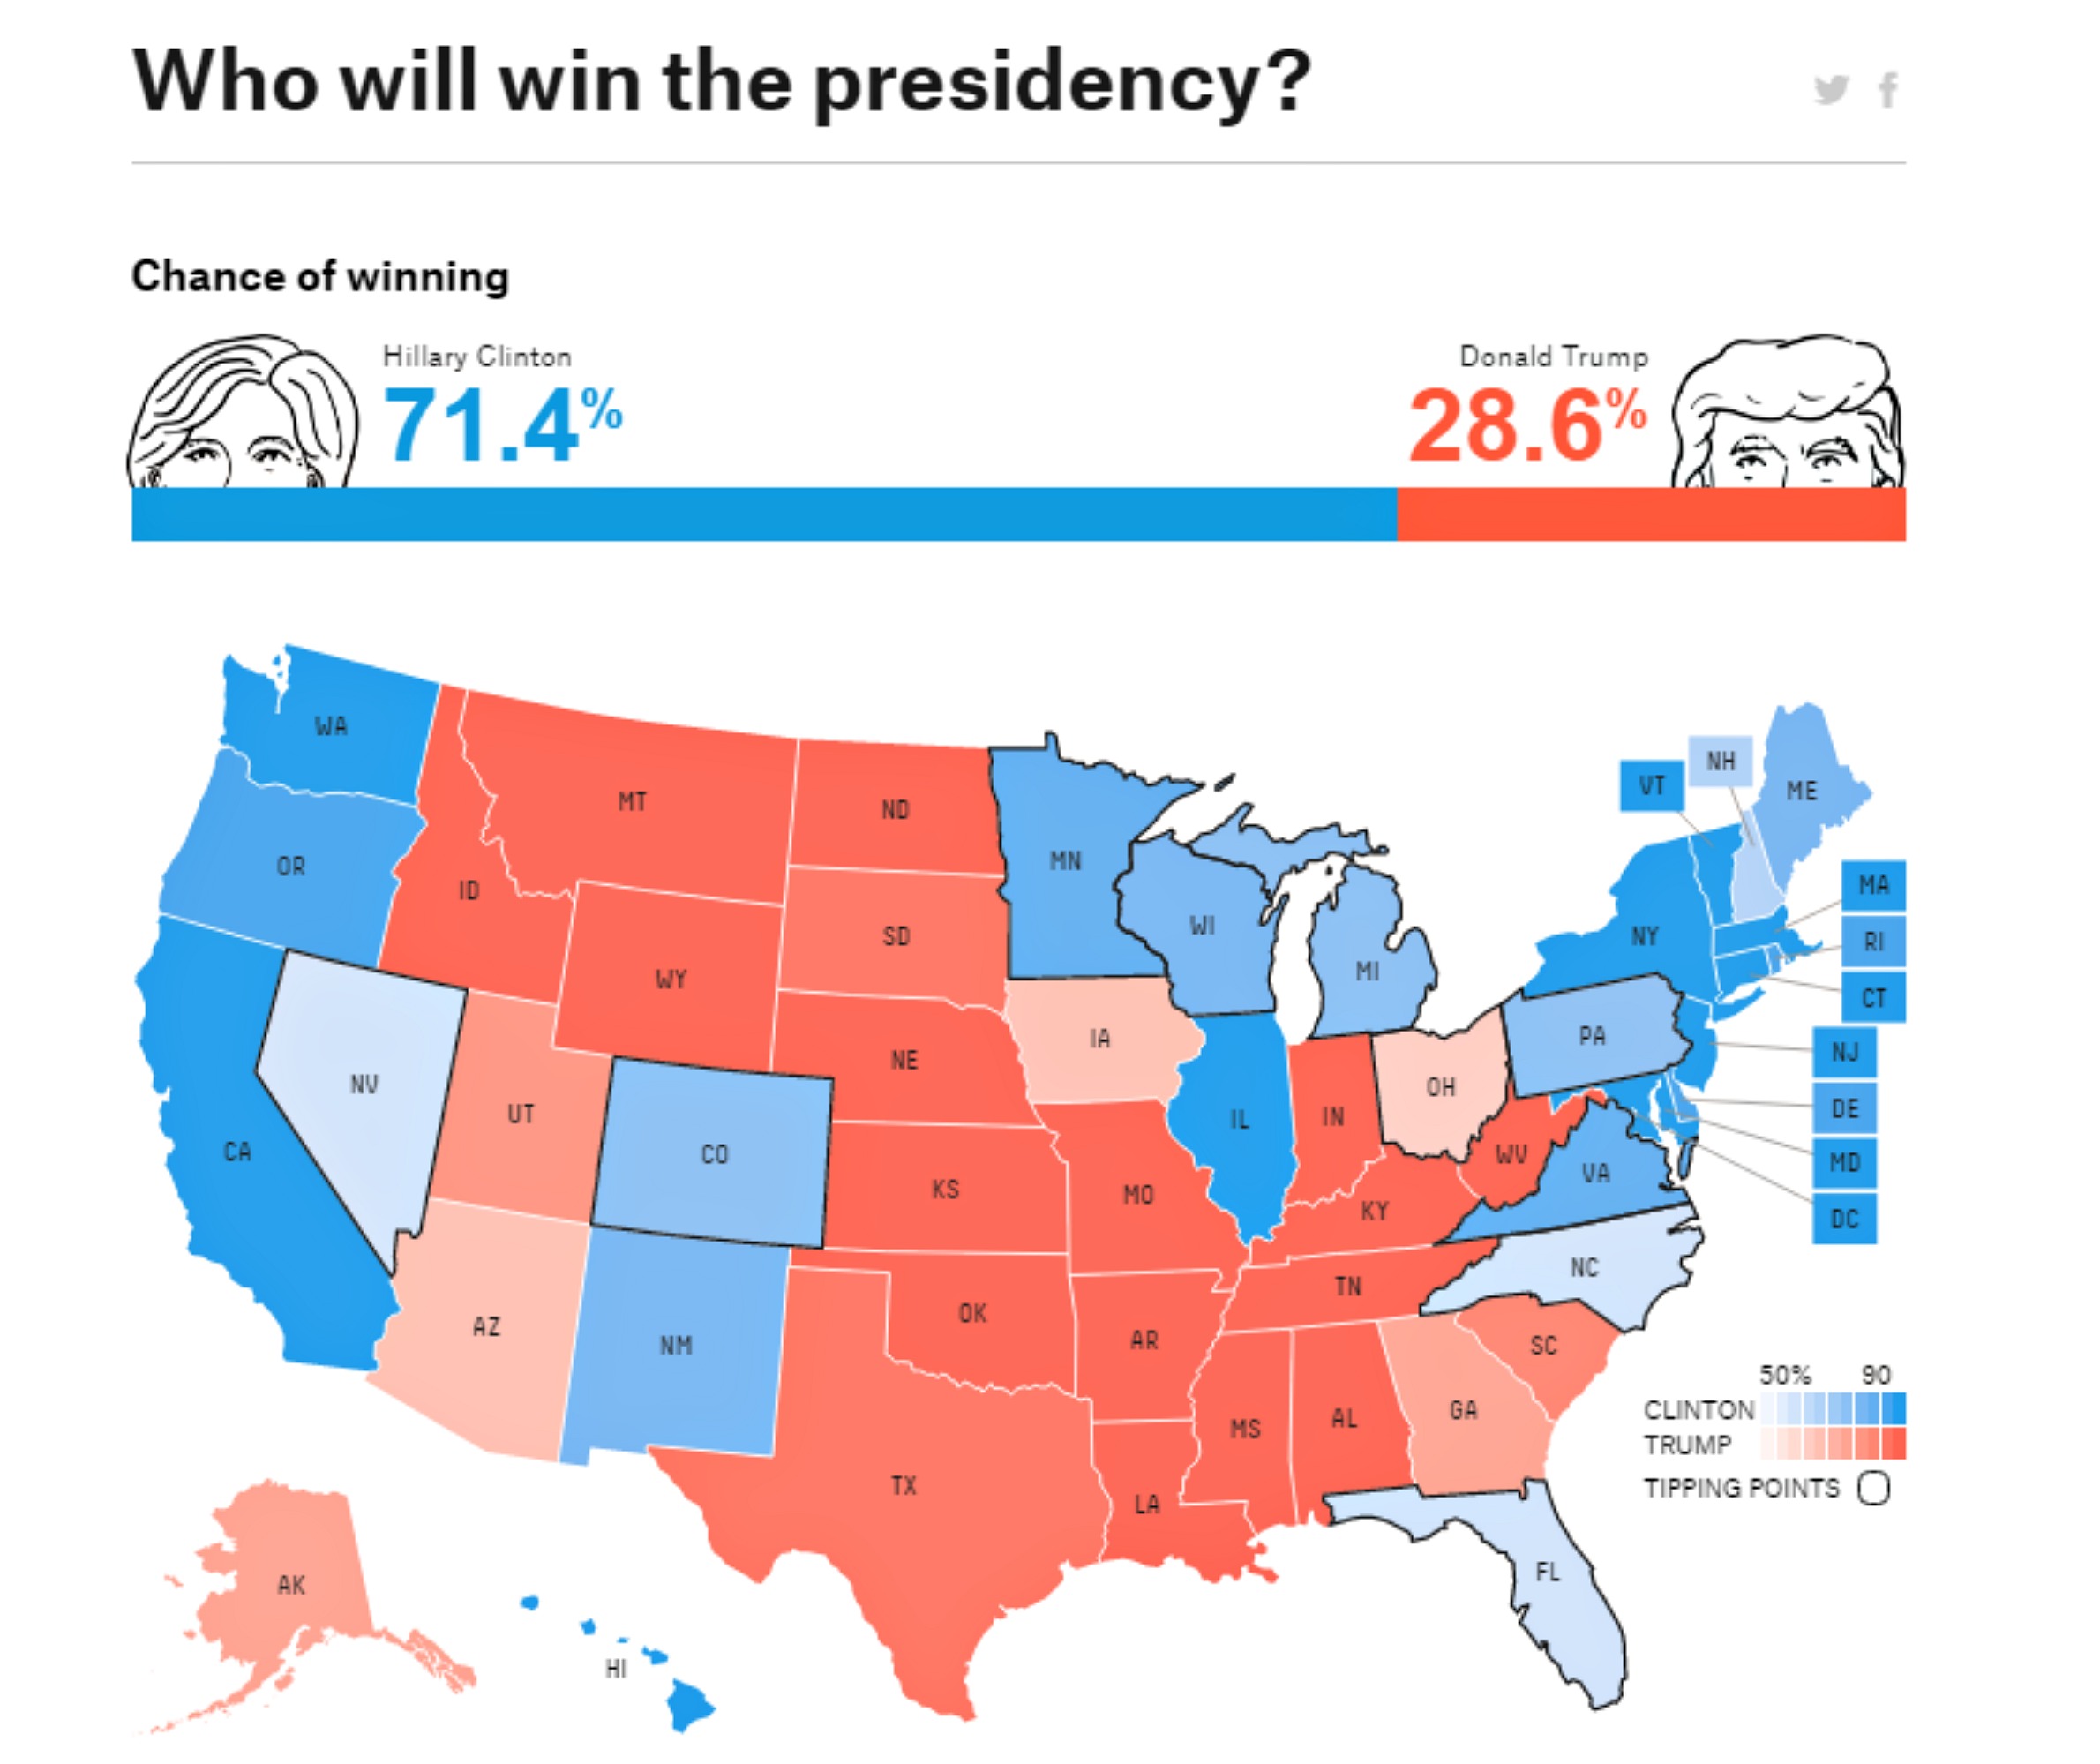
The 2016 presidential election results took many people of all political stripes by surprise. National polls favored a victory by Hillary Clinton over Donald Trump in the weeks and even hours leading up to closing of polls on Election Day. Those inaccurate tallies were magnified by polling aggregators, like the popular FiveThirtyEight, that gather and average the results of many polls.
It will be a while before it is fully understood why figures released by many reputable state and national polls were off, some by a wide margin. Until then, history may offer some potential explanations.
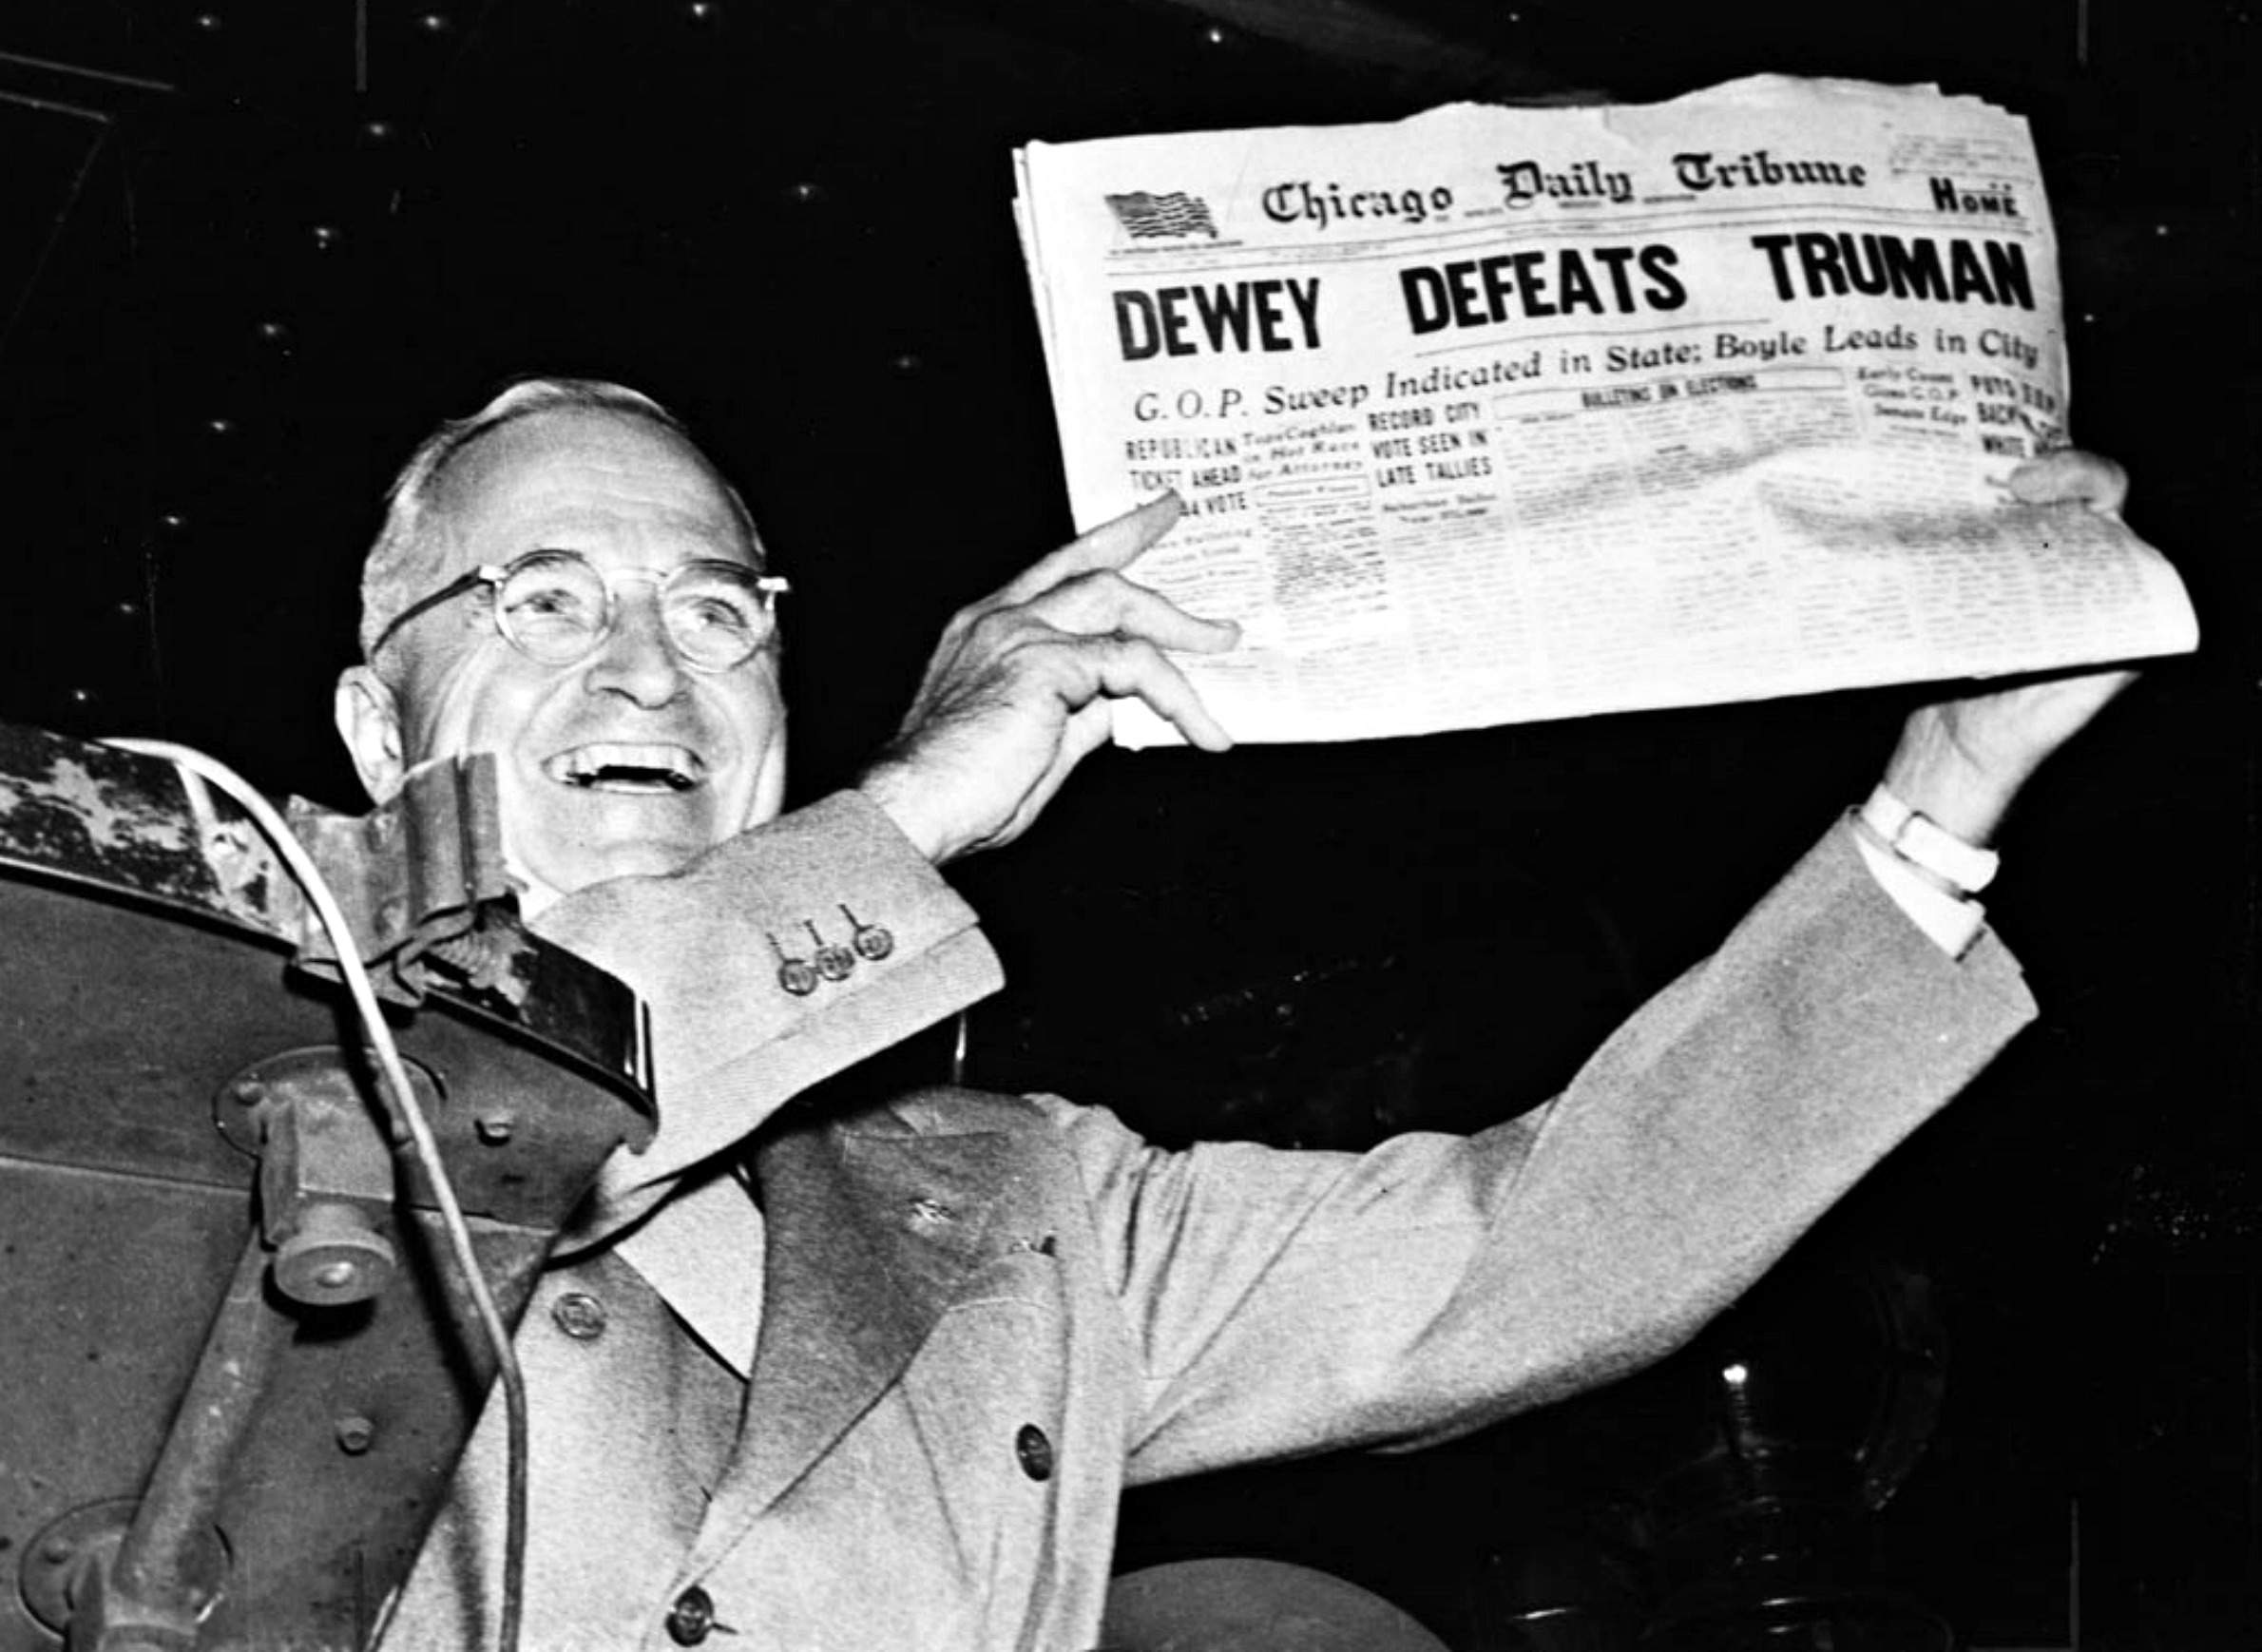
The famous "Dewey Defeats Truman" headline in the Nov. 3, 1948, edition of the Chicago Daily Tribune was a result of polls predicting a victory by Thomas Dewey in the 1948 presidential election by a comfortable 5 to 15 percentage points rather than the 4.4 percentage point victory actually won by incumbent Harry Truman. Nearly 70 years later, this infamous error is a good starting point for understanding how political polling can miss its mark.
When the electorate changes, and the electorate is always changing, profiles of "likely voters" from previous elections might be inconsistent with profiles of "likely voters" from the current election.
The adage you can never step into the same river twice applies to elections as well as the Mississippi, Kickapoo and Fox rivers. This election's voters and last election's voters are never completely alike.
The polls used to predict Dewey's victory in 1948 were based on non-probability quota samples in which participants were chosen by interviewers who were given a quota of a certain number of men, women, urban and rural residents, and so on designed to match the electorate from earlier national elections. Interviewers were allowed to choose participants that fit the quota at their discretion. In retrospect, it is obvious that those available and likely to vote in 1948, the first postwar and post-Depression election, would be different than those who voted in 1944, 1940 or 1936. However, at the time this distinction wasn't as clear.
A great deal of bias is introduced into a poll when interviewers are allowed to choose participants. In the 21st century, the most reputable polls rely on probability sampling in which respondents are chosen at random, and anyone within a target population has an equal chance at being included. This eliminates bias seen in non-probability (non-random) samples and offers a stronger guarantee that what is found in a poll is statistically representative of the general population.
Yet, the manner in which the target population and sampling frame are set to create the boundaries that define who could be chosen to survey matters a great deal. A target population that intends to capture likely voters, those qualified who are inclined to vote, will capture a different group than one that intends to capture registered voters, those qualified and registered to vote but whose inclinations toward voting in a particular election are unknown.
Polling organizations have sophisticated models for predicting who is likely to cast a ballot in a particular election. For example, Gallup uses a series of questions ranging from the amount of thought individuals have given to an election to whether they know the location of their local polling place, how often they vote and if they think they’ll vote in that particular election, among other questions, to determine their likelihood of voting.
Still, predicting likely voters is not easy. Indeed, in 1998, on the 50th anniversary of the 1948 election, Warren Mitofsky, a pioneer in political polling, told the Los Angeles Times that "identifying likely voters is still a mystery to most polling organizations." Although it will be a while before we are able to fully compare the 2016 voter profiles with those from previous presidential elections, the mark may have shifted just as it did in 1948.
Weighting and over-sampling are necessary, but tricky.
Despite the best methods and efforts of polling organizations, certain demographic groups remain underrepresented in polls that use probability sampling.
Polling organizations address this defect in a number of ways. A poll may intentionally over-sample a population, making a greater number of phone calls to those in a demographic group known to respond less often, in an attempt to capture a sufficient number of responses to accurately represent that group.
When efforts fail to produce a perfectly representative sample, polls weight the results of respondents. Nearly all polls do this. Weighting involves assigning a greater numerical value to the response of certain individuals to adjust for the characteristics, like age, sex and race of a population.
Weighting is an imperfect science that pollsters approach carefully, knowing that incorrectly weighting respondents can introduce bias into the poll and produce inaccurate results. Even the most carefully performed weighting can't make up for gross underrepresentation of a demographic. Multiplying the response of a single representative of a hard-to-find group doesn't account for variation in the opinions among members of that group. Despite rigorous use of probability sampling and careful weighting, though, polls can produce inaccurate results. Asking the right questions is just as important.
Kristin Runge is a communication researcher and community development specialist with the University of Wisconsin-Extension Center for Community and Economic Development.