NASA
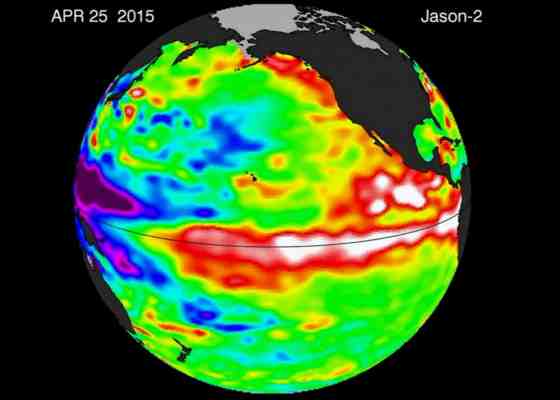
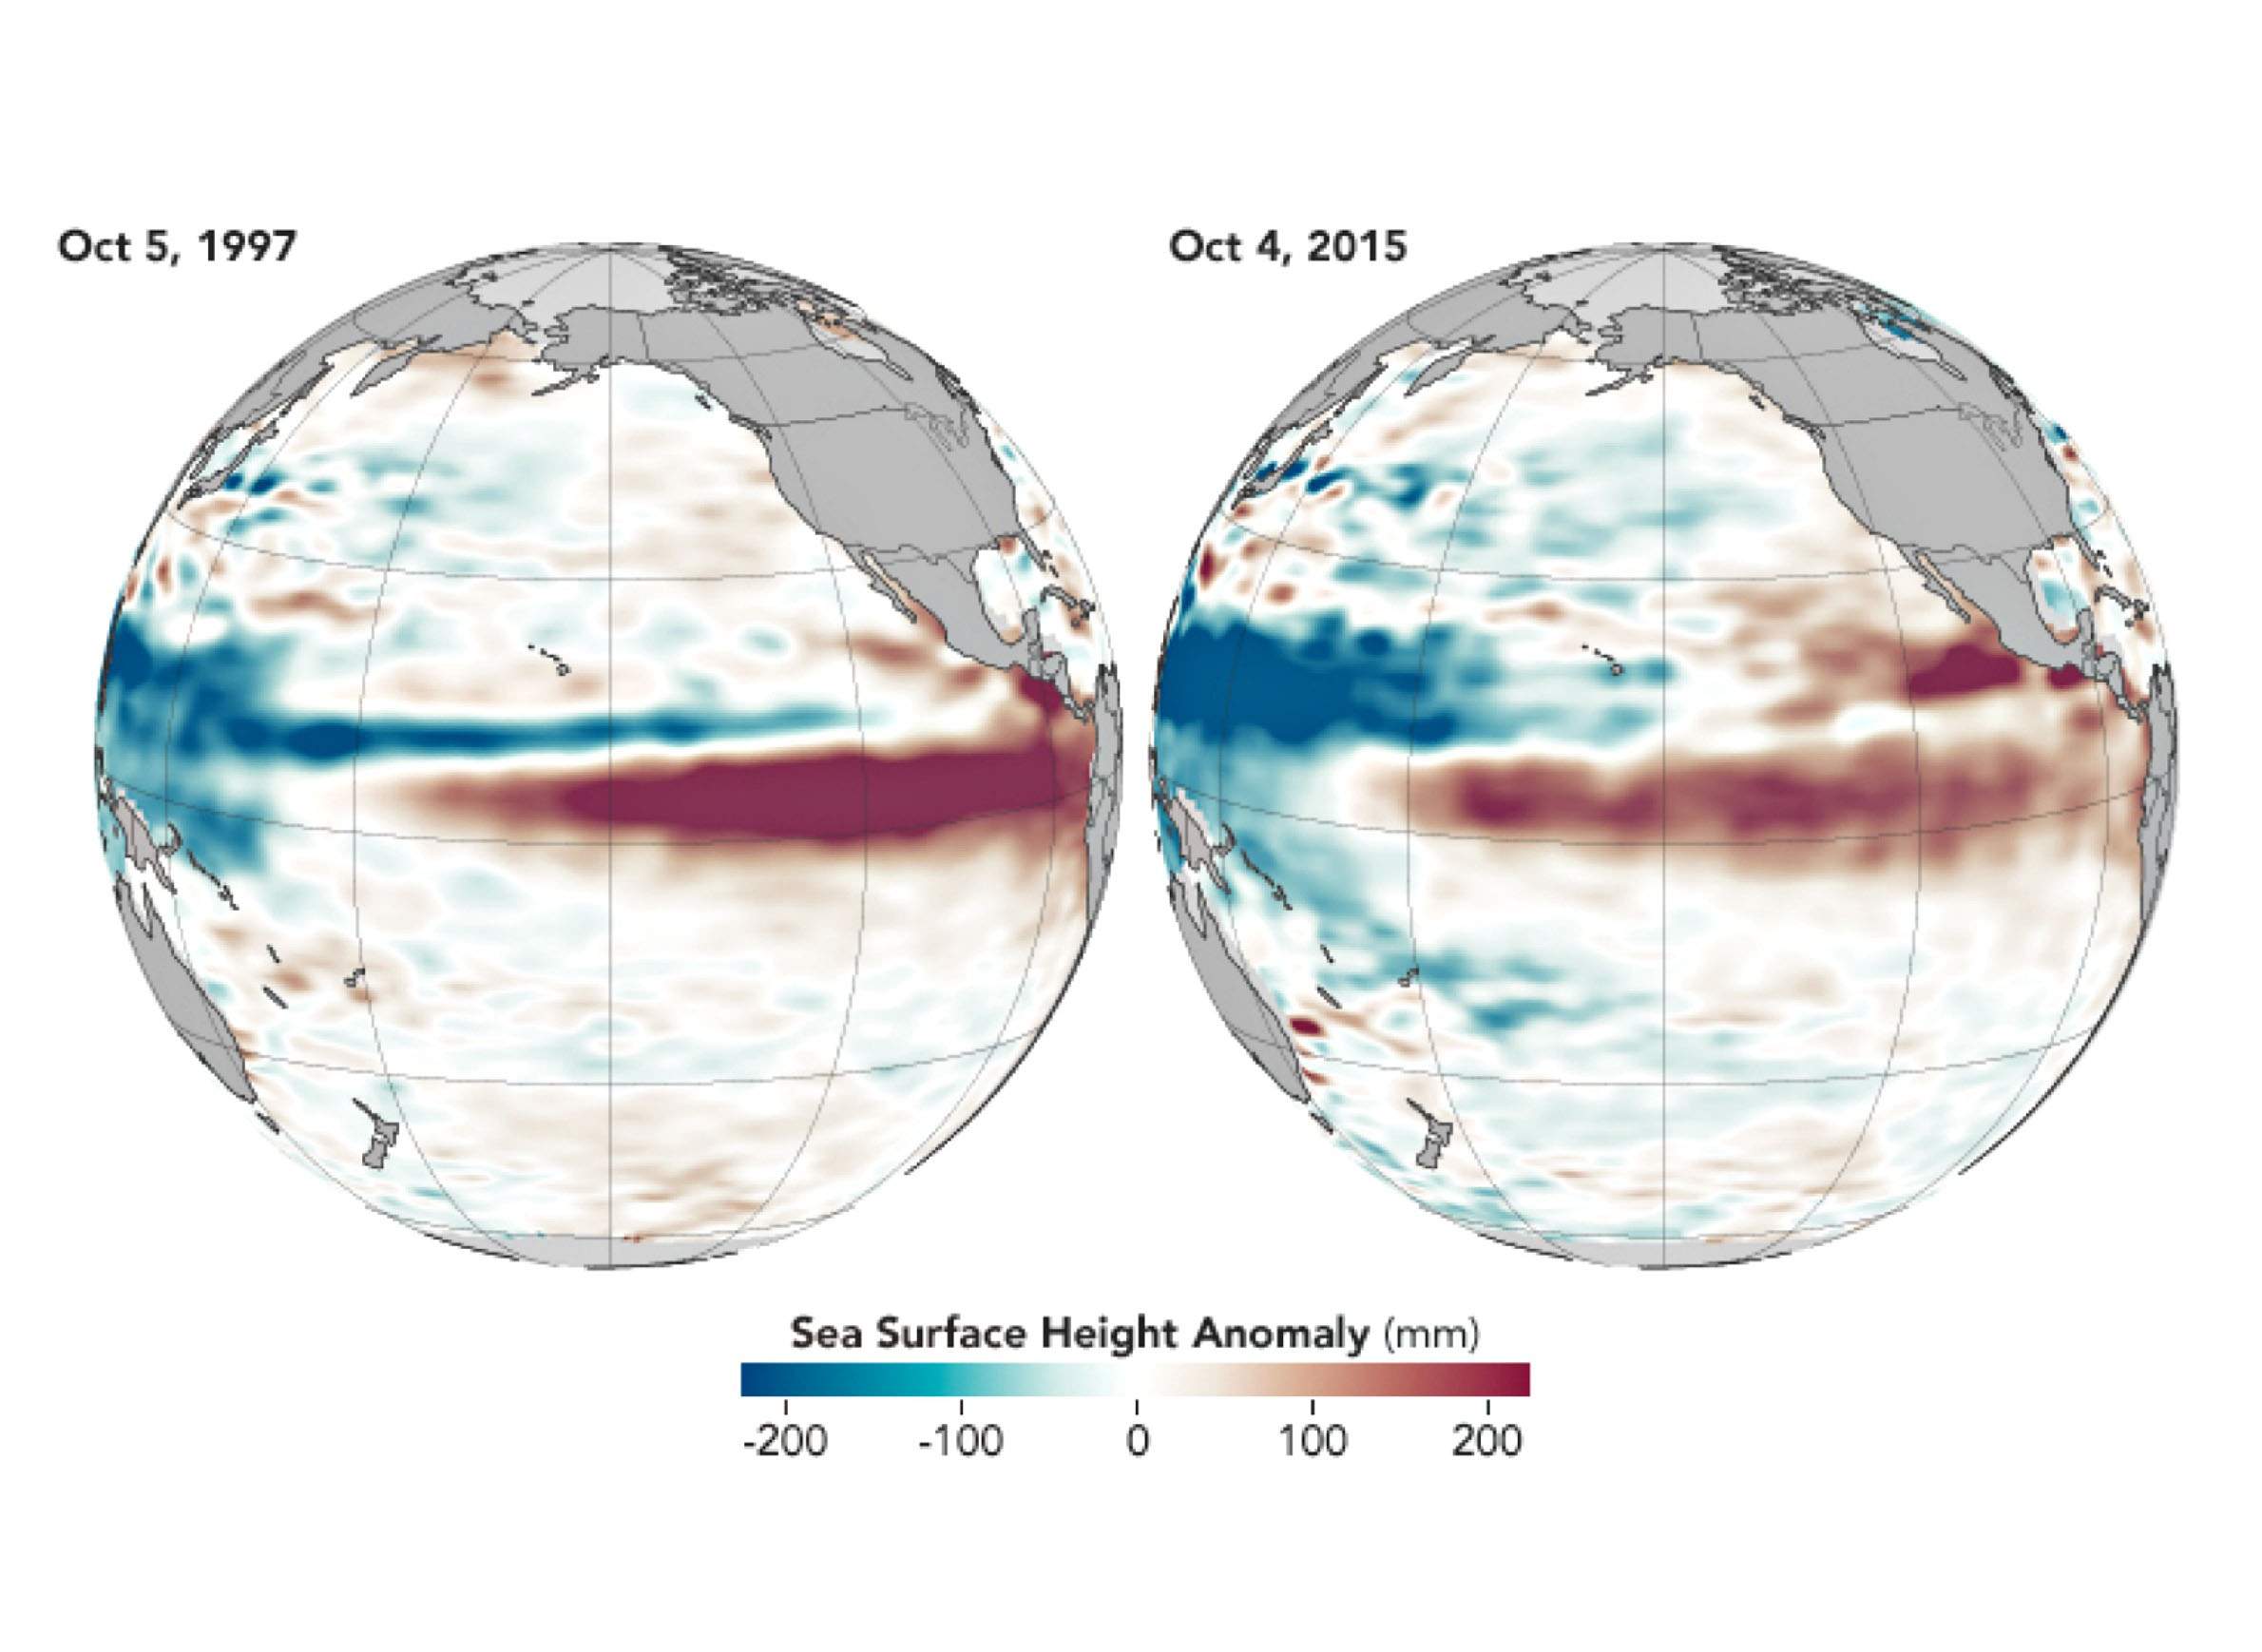
NASA maps show similiarly elevated sea surface height levels in the southern Pacific in both 1997 and 2015.

NASA maps show similiarly elevated sea surface height levels in the southern Pacific in both 1997 and 2015.
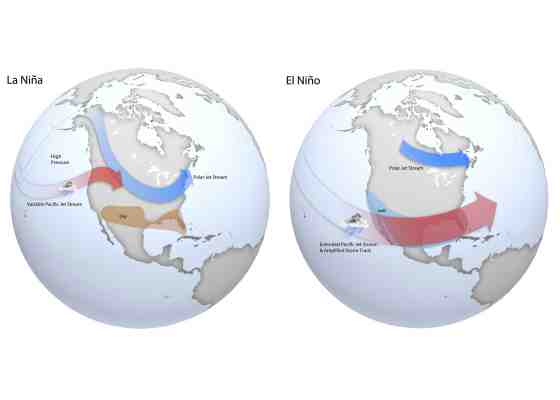
The El Niño of 1997-98 was historic, but no two ENSO events are alike, nor are their weather effects in any given location, thanks to differences in how Pacific Ocean waters warm.
Climatologists and meteorologists labor to emphasize this point.
"While El Niño is broadly defined as a warm anomaly in the equatorial Pacific Ocean with an atmospheric coupling, not all El Niño events are created equal," the Midwest Regional Climate Center noted. "Sea surface temperature anomalies during an El Niño event can differ greatly from one El Niño event to another depending on ocean temperatures, the location of the warmest waters, and timing of the warmest waters."
However, the specific pattern of how the 1997-98 El Niño developed in the Pacific Ocean is similar to what has been observed so far during 2015. This comparison is due to the early detection of warming sea surface temperatures in early 2015, and to the amount that continued through summer and fall.
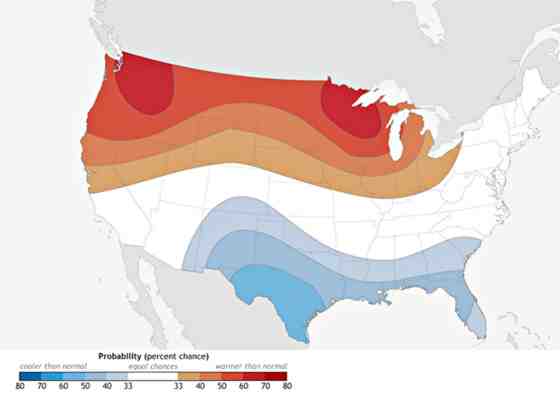
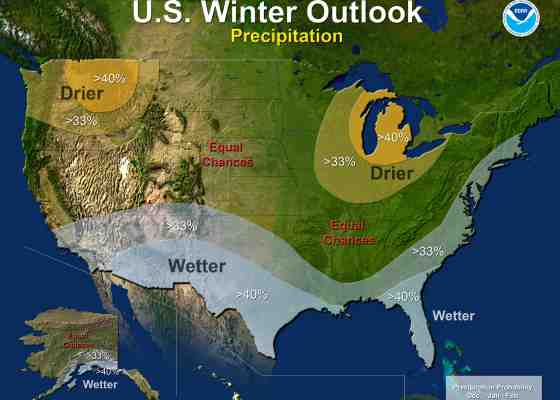
"We know that a strong El Nino is likely to influence the U.S.winter in a somewhat predictable way," said University of Wisconsin-Madison meteorology professor John Young in an interview with The Capital Times. "Eighteen years ago, in the previous strong El Nino we had only three days of temperatures below zero degrees (Fahrenheit), about eight times fewer than when our normals in the past had been closer to three weeks. That’s the kind of thing that could happen this year."
By September, the warming trend was expected to strengthen, the World Meteorological Organization noted in an El Niño/La Niña update. Specifically, models indicated water temperatures in the tropical eastern Pacific Ocean were more than 2 degrees Celsius above average, making current El Niño conditions comparable to those in 1997-98, 1982-83 and 1972-73, the strongest events since 1950.
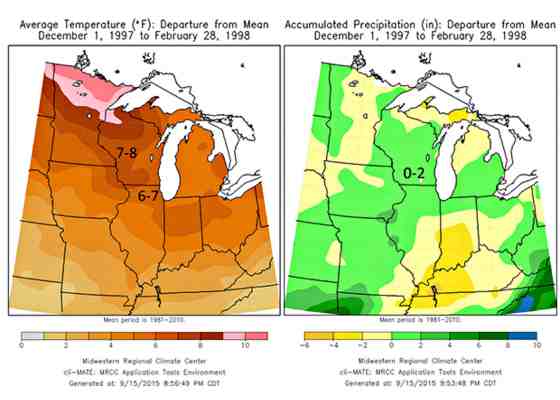
The Midwest Regional Climate Center's interactive map puts climatic shifts in the United States into historical context. For September 2015, it shows considerably warmer temperatures — 4 to 6 degrees Fahrenheit above average — across Wisconsin. State-level meteorological data show that month was among warmest Septembers ever recorded in Wisconsin.
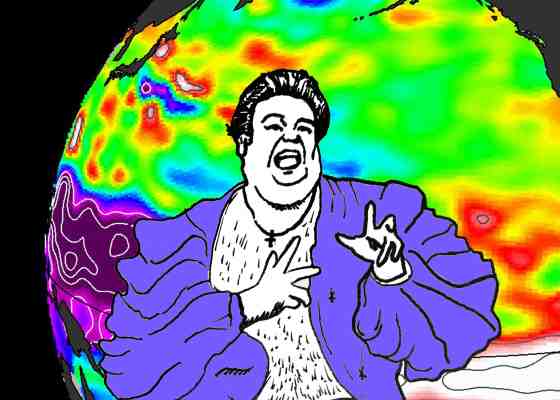
Climatologists also track developing El Niño conditions by measuring sea surface heights in the Pacific with satellites like TOPEX/Poseidon, Jason-1 and Jason-2. (These satellites are also instrumental in ongoing climate change research.) Because warmer water expands, the ocean surface can be as much as 200 millimeters higher in warming areas.
The surface water temperatures of the tropical eastern Pacific Ocean became warmer than normal, between January and August of 1997 and 2015, as highlighted by the National Center for Atmospheric Research in a video depicting sea surface temperature anomaly data.
The animation was created by Matt Rehm of the Visualization Lab at the National Center for Atmospheric Research.
"I was a little shocked just how closely 2015 resembles 1997 visually," he said.
However, the center emphasizes that every El Niño event is unique like a "snowflake," and that these similarities are "no guarantee that the impacts on weather around the world will be the same as they were in 1997-'98."
In July through September 2015, sea surface temperatures were 1.5 degrees Celsius above average, which was exceeded during El Niño years of 1997 (1.7 degrees Celsius) and 1982 (1.6 degrees Celsius). By October, the sea height in the eastern Pacific Ocean was broadly comparable to conditions during the 1997-98 El Niño.
One difference is the 2015 El Niño event developed a bit earlier in the year than in 1997, with warmer waters stretching across the Pacific tropics more than a month sooner. And unlike previous strong El Niño events, this one coexists with "the blob," a large area of warm water in the eastern North Pacific Ocean, off the coast of North America, that is separate from the primary El Niño warming zone. The warming in this body of water is related to an area of high air pressure that contributes to the ongoing drought in the western United States and has displaced nautical wildlife throughout the offshore region stretching from Alaska to Mexico.
The origins of "the blob" are not well understood, nor are its potential interactions with weather patterns driven by El Niño conditions. One speculation is that "the blob" could lead to more rain (as opposed to snow) for California, which would do less to alleviate its drought and more to exacerbate flooding and landslides. Scientists are examining "the blob" and its effects as a potential preview of what effects generally warmer oceanic conditions could have on wildlife and human fisheries amidst ongoing climate change.
Ultimately, comparisons are useful to better understand how a given El Niño event develops, but they do not necessarily help climatologists predict what will happen.
"While the 2015-16 El Niño is expected to be similar to the 1997-98 El Niño in both strength and location of the warmest waters in the equatorial Pacific, it may not be a good idea to directly compare the two," the Midwest Regional Climate Center concluded. "Even if the 2015-16 El Niño results in the same impacts as other strong El Niño events, it may not be for the same reasons."